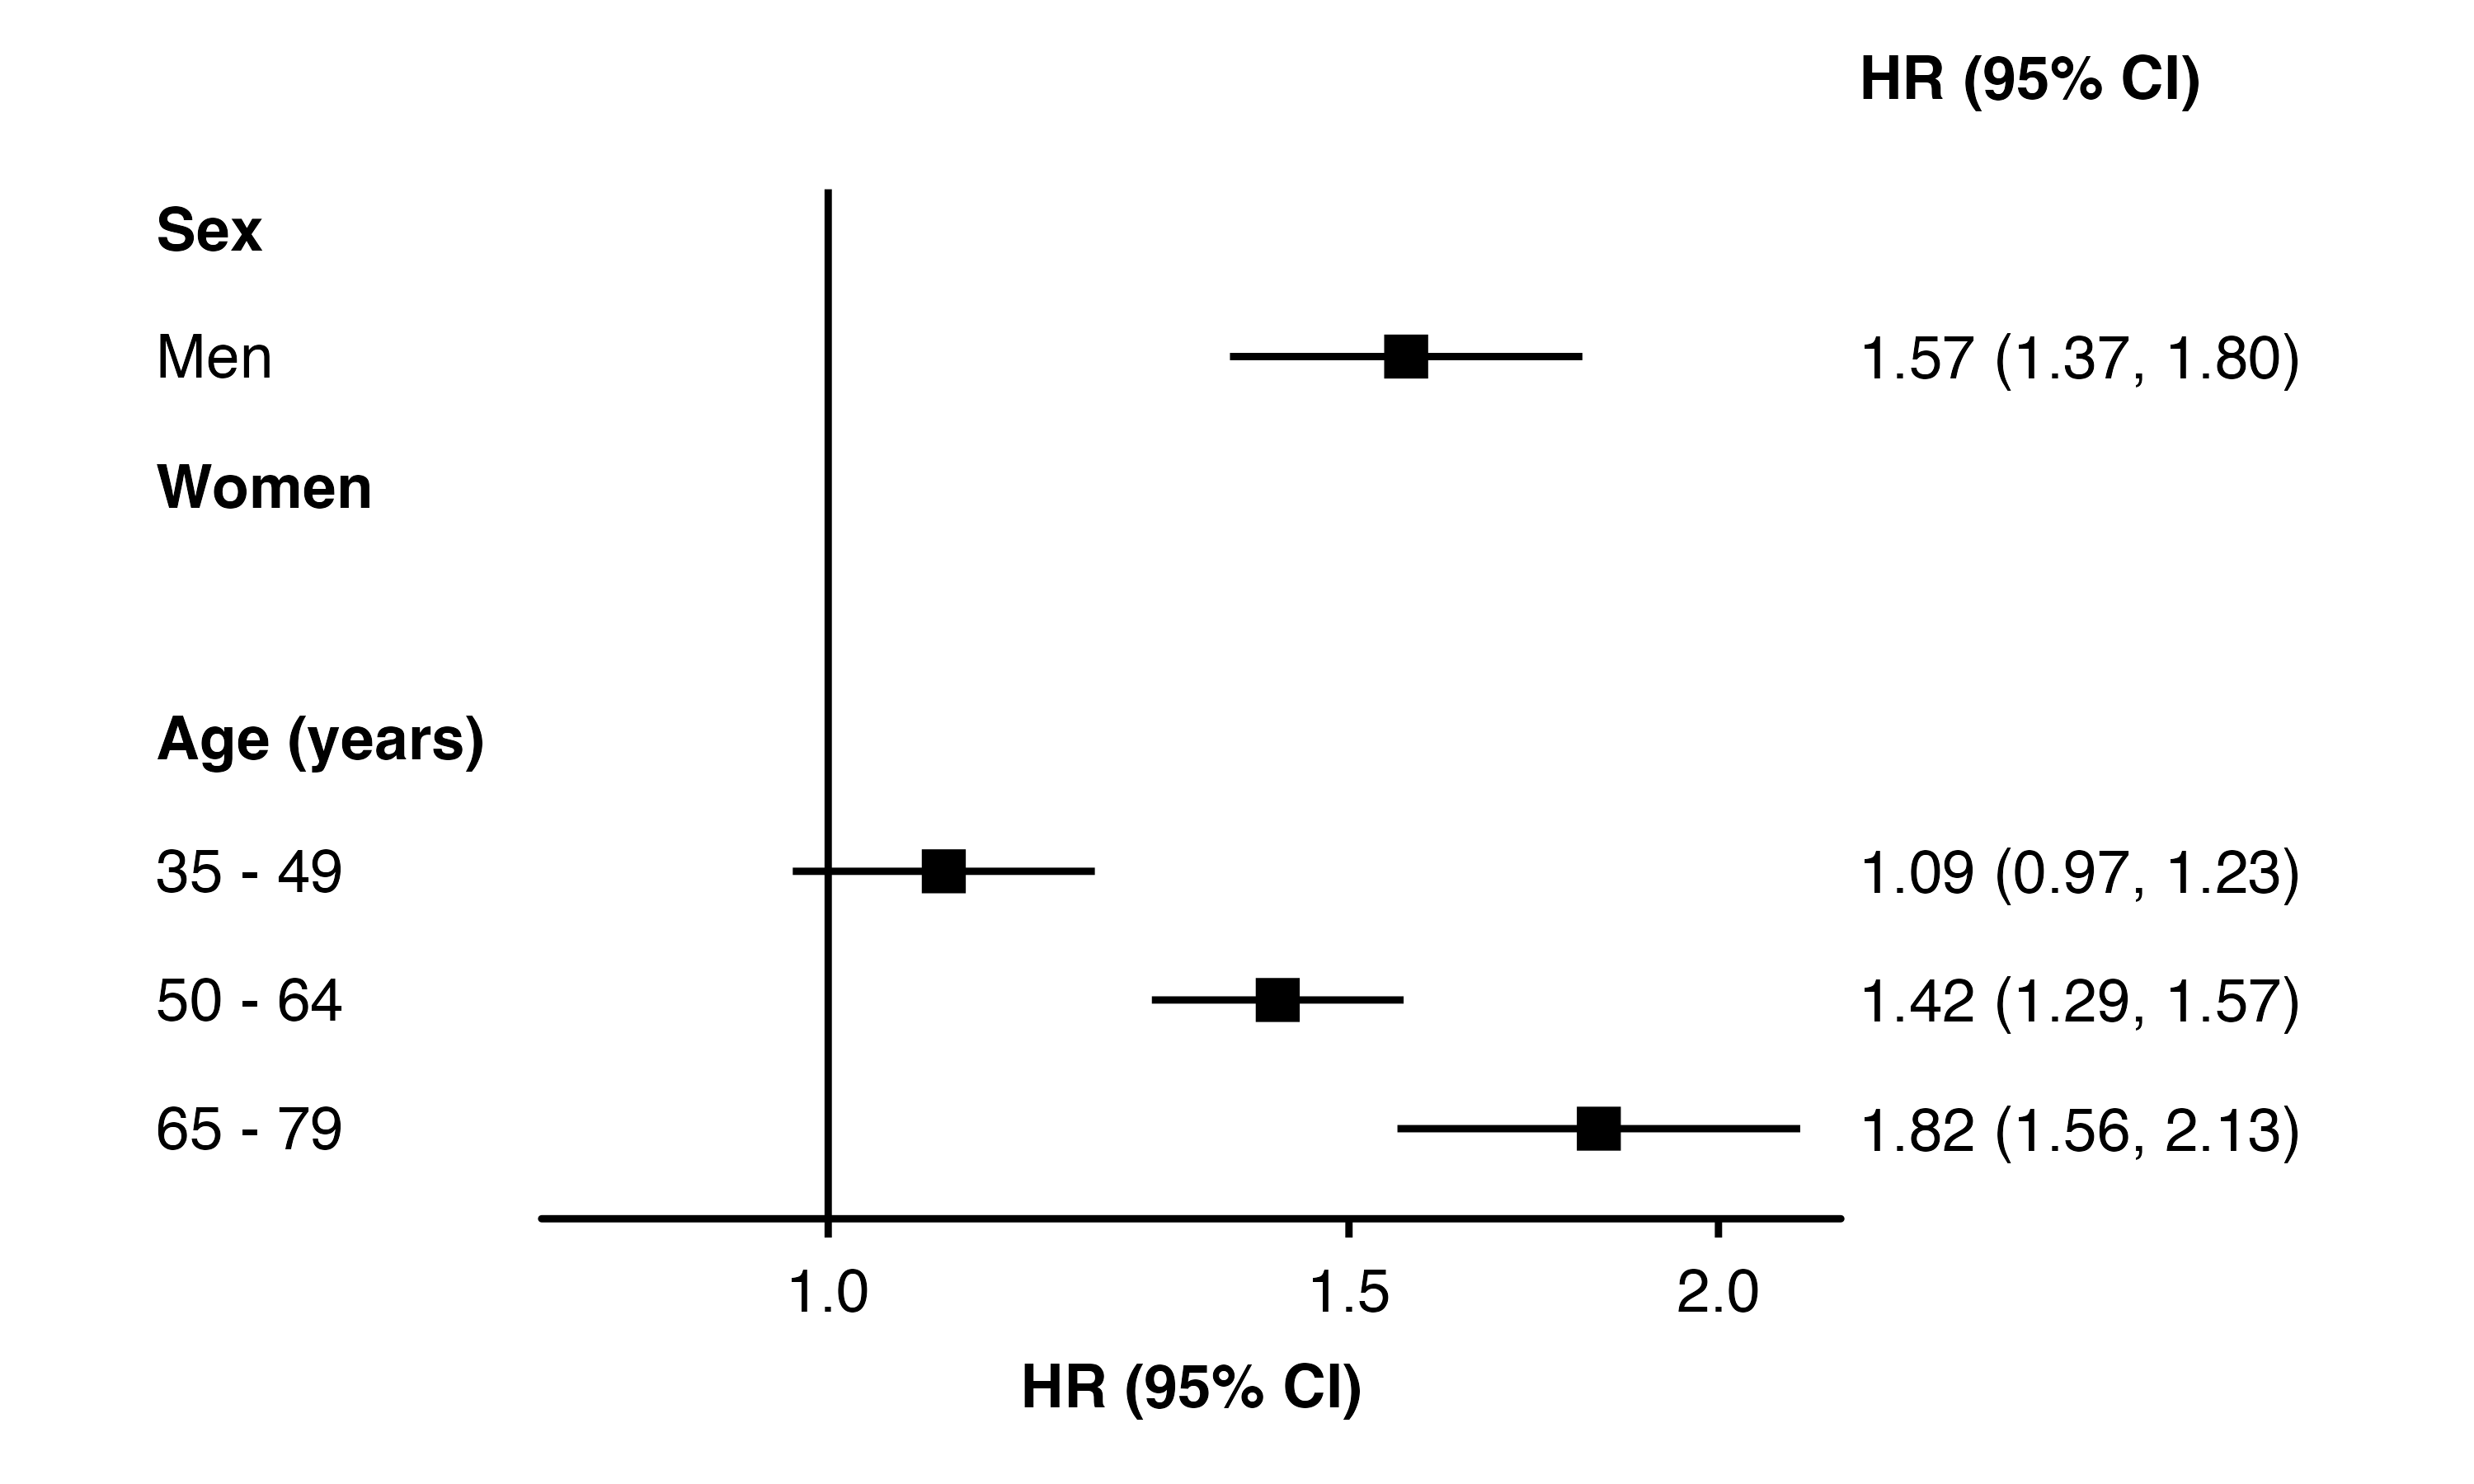
Any row labels without an estimate (such as row label sub-headings and those missing an estimate) are formatted as bold. For example, the “Sex” and “Age (years)” sub-headings as well as the “Women” row label in this plot:
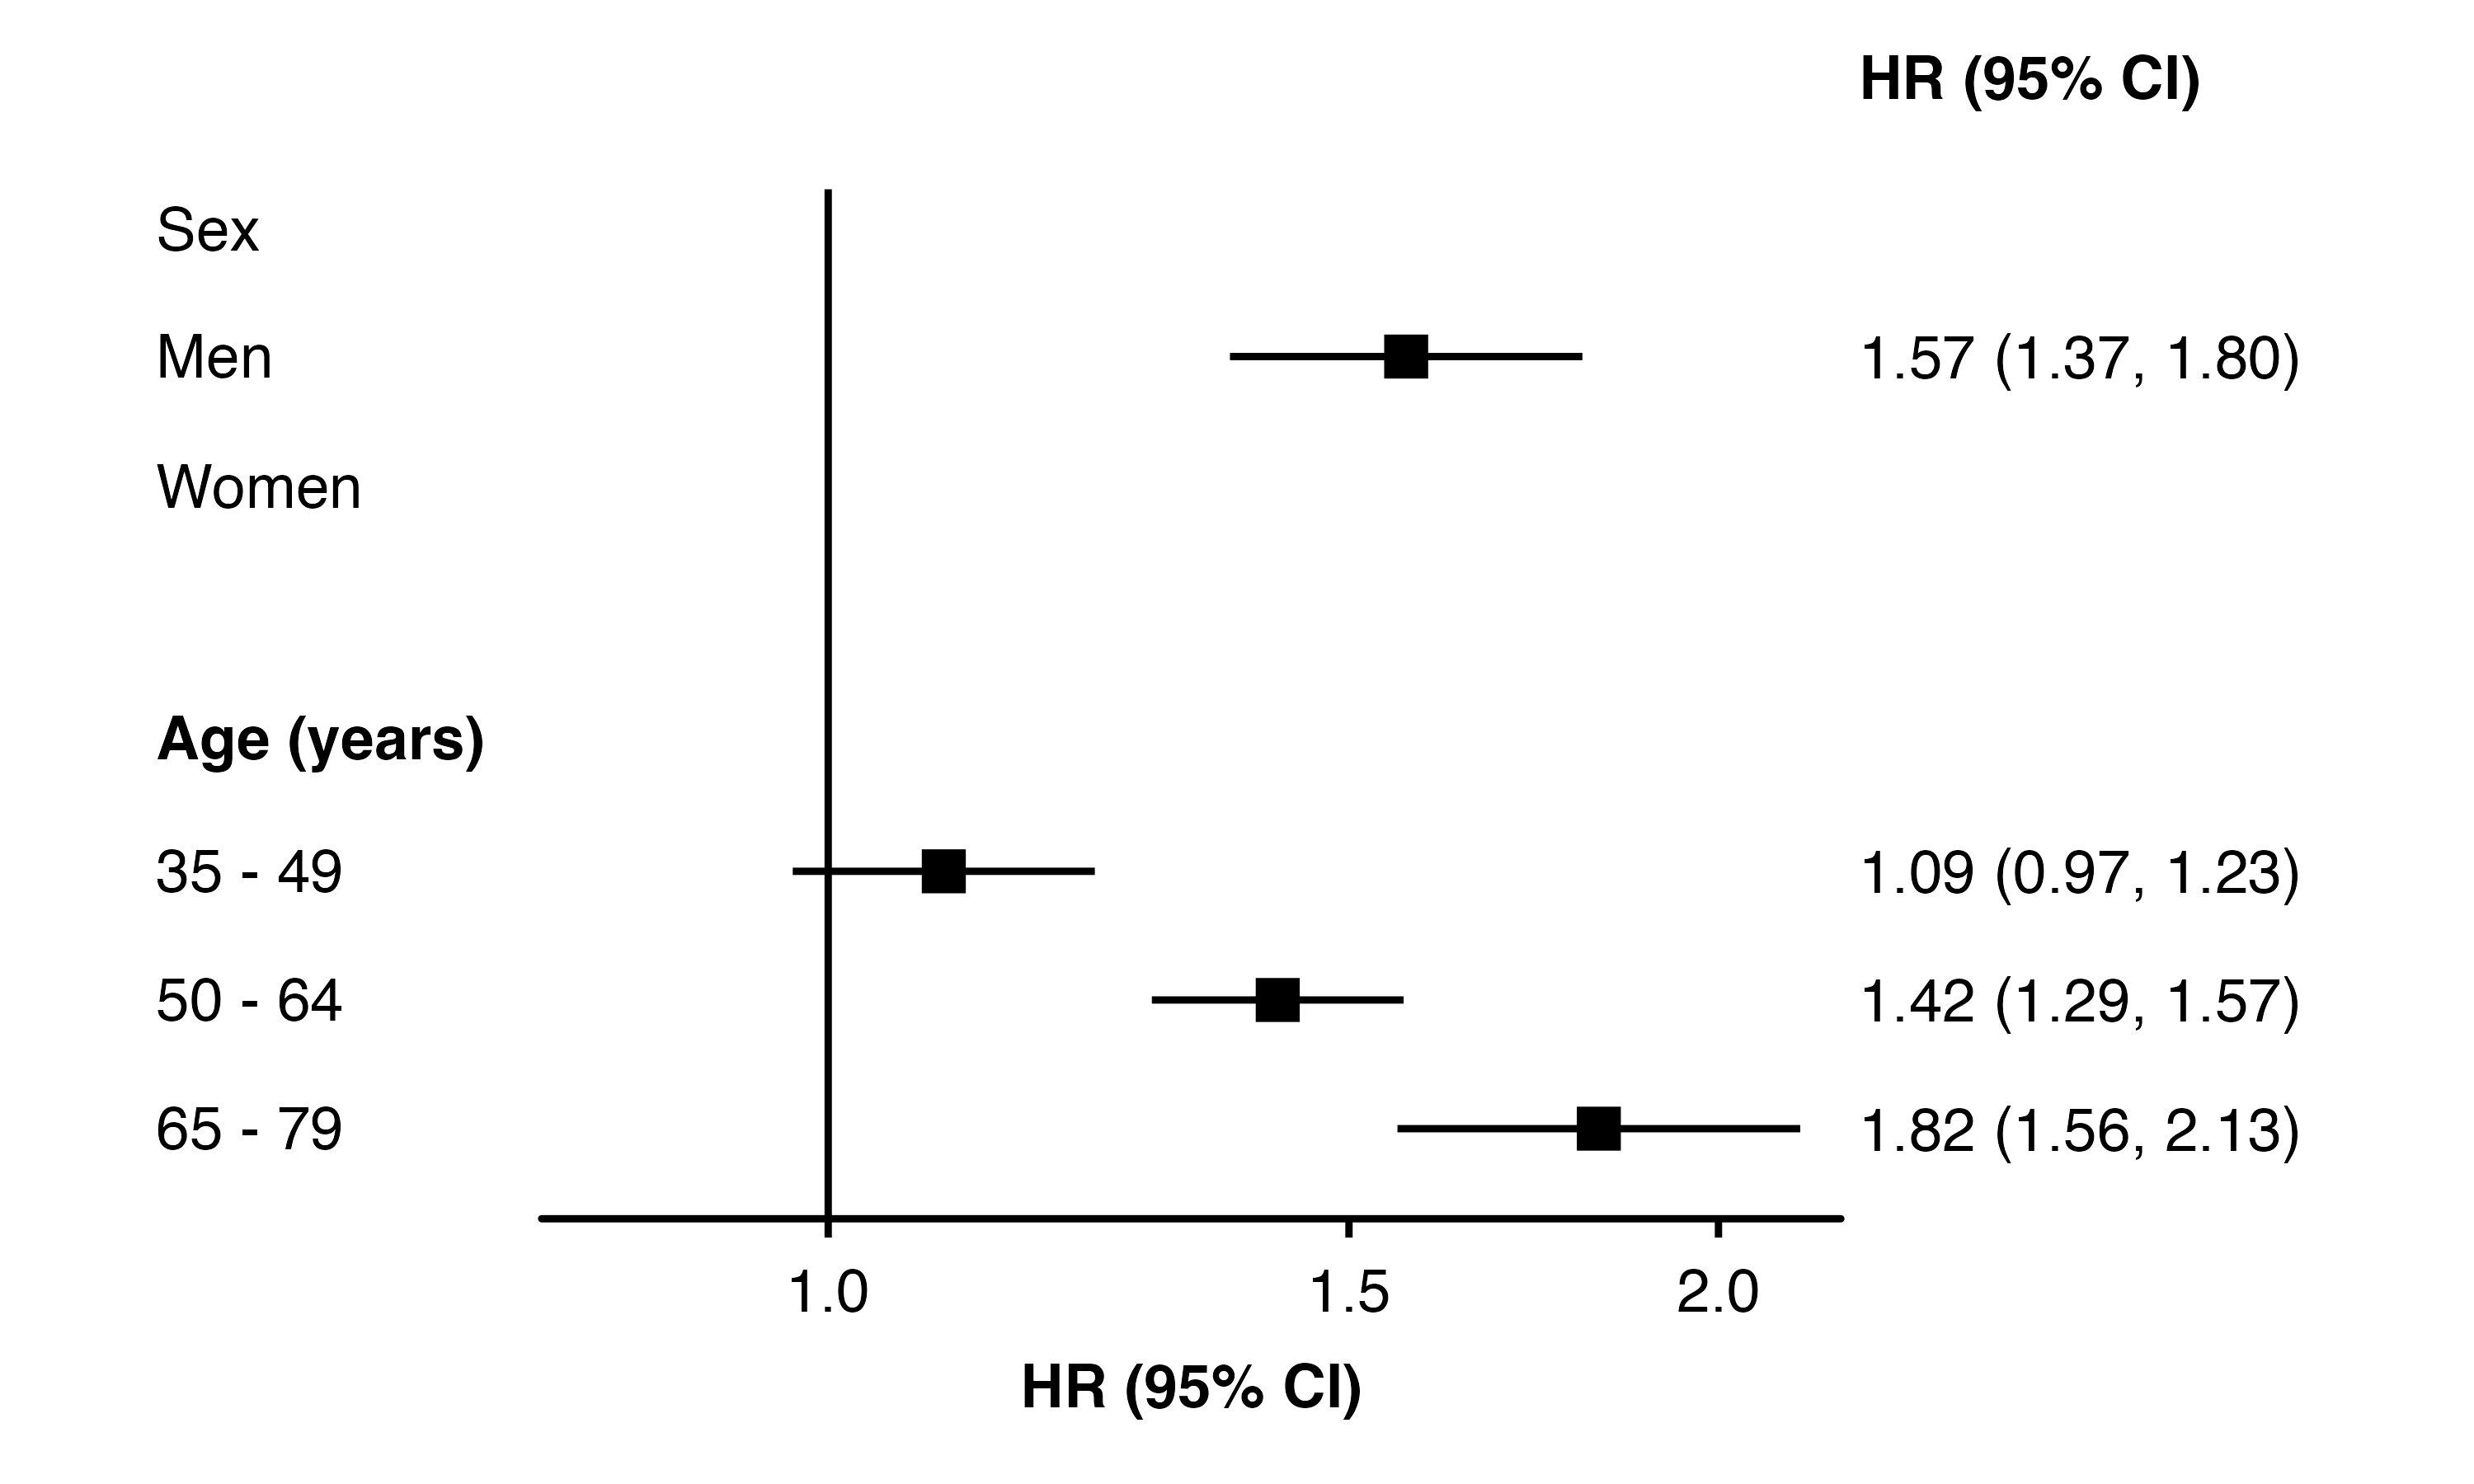
This is because forest_plot() automatically adds ** around such labels. If you do not want such a label to appear bold, then the pattern "\u200B**label**\u200B" can be used.*
For example, the “Sex” and “Women” row labels in this plot: