There are various ways to remove parts of plots (or make them not appear) created with shape_plot() and forest_plot(). Which will work best may depend on how you are using the code, some examples are:
Remove text by replacing the layer
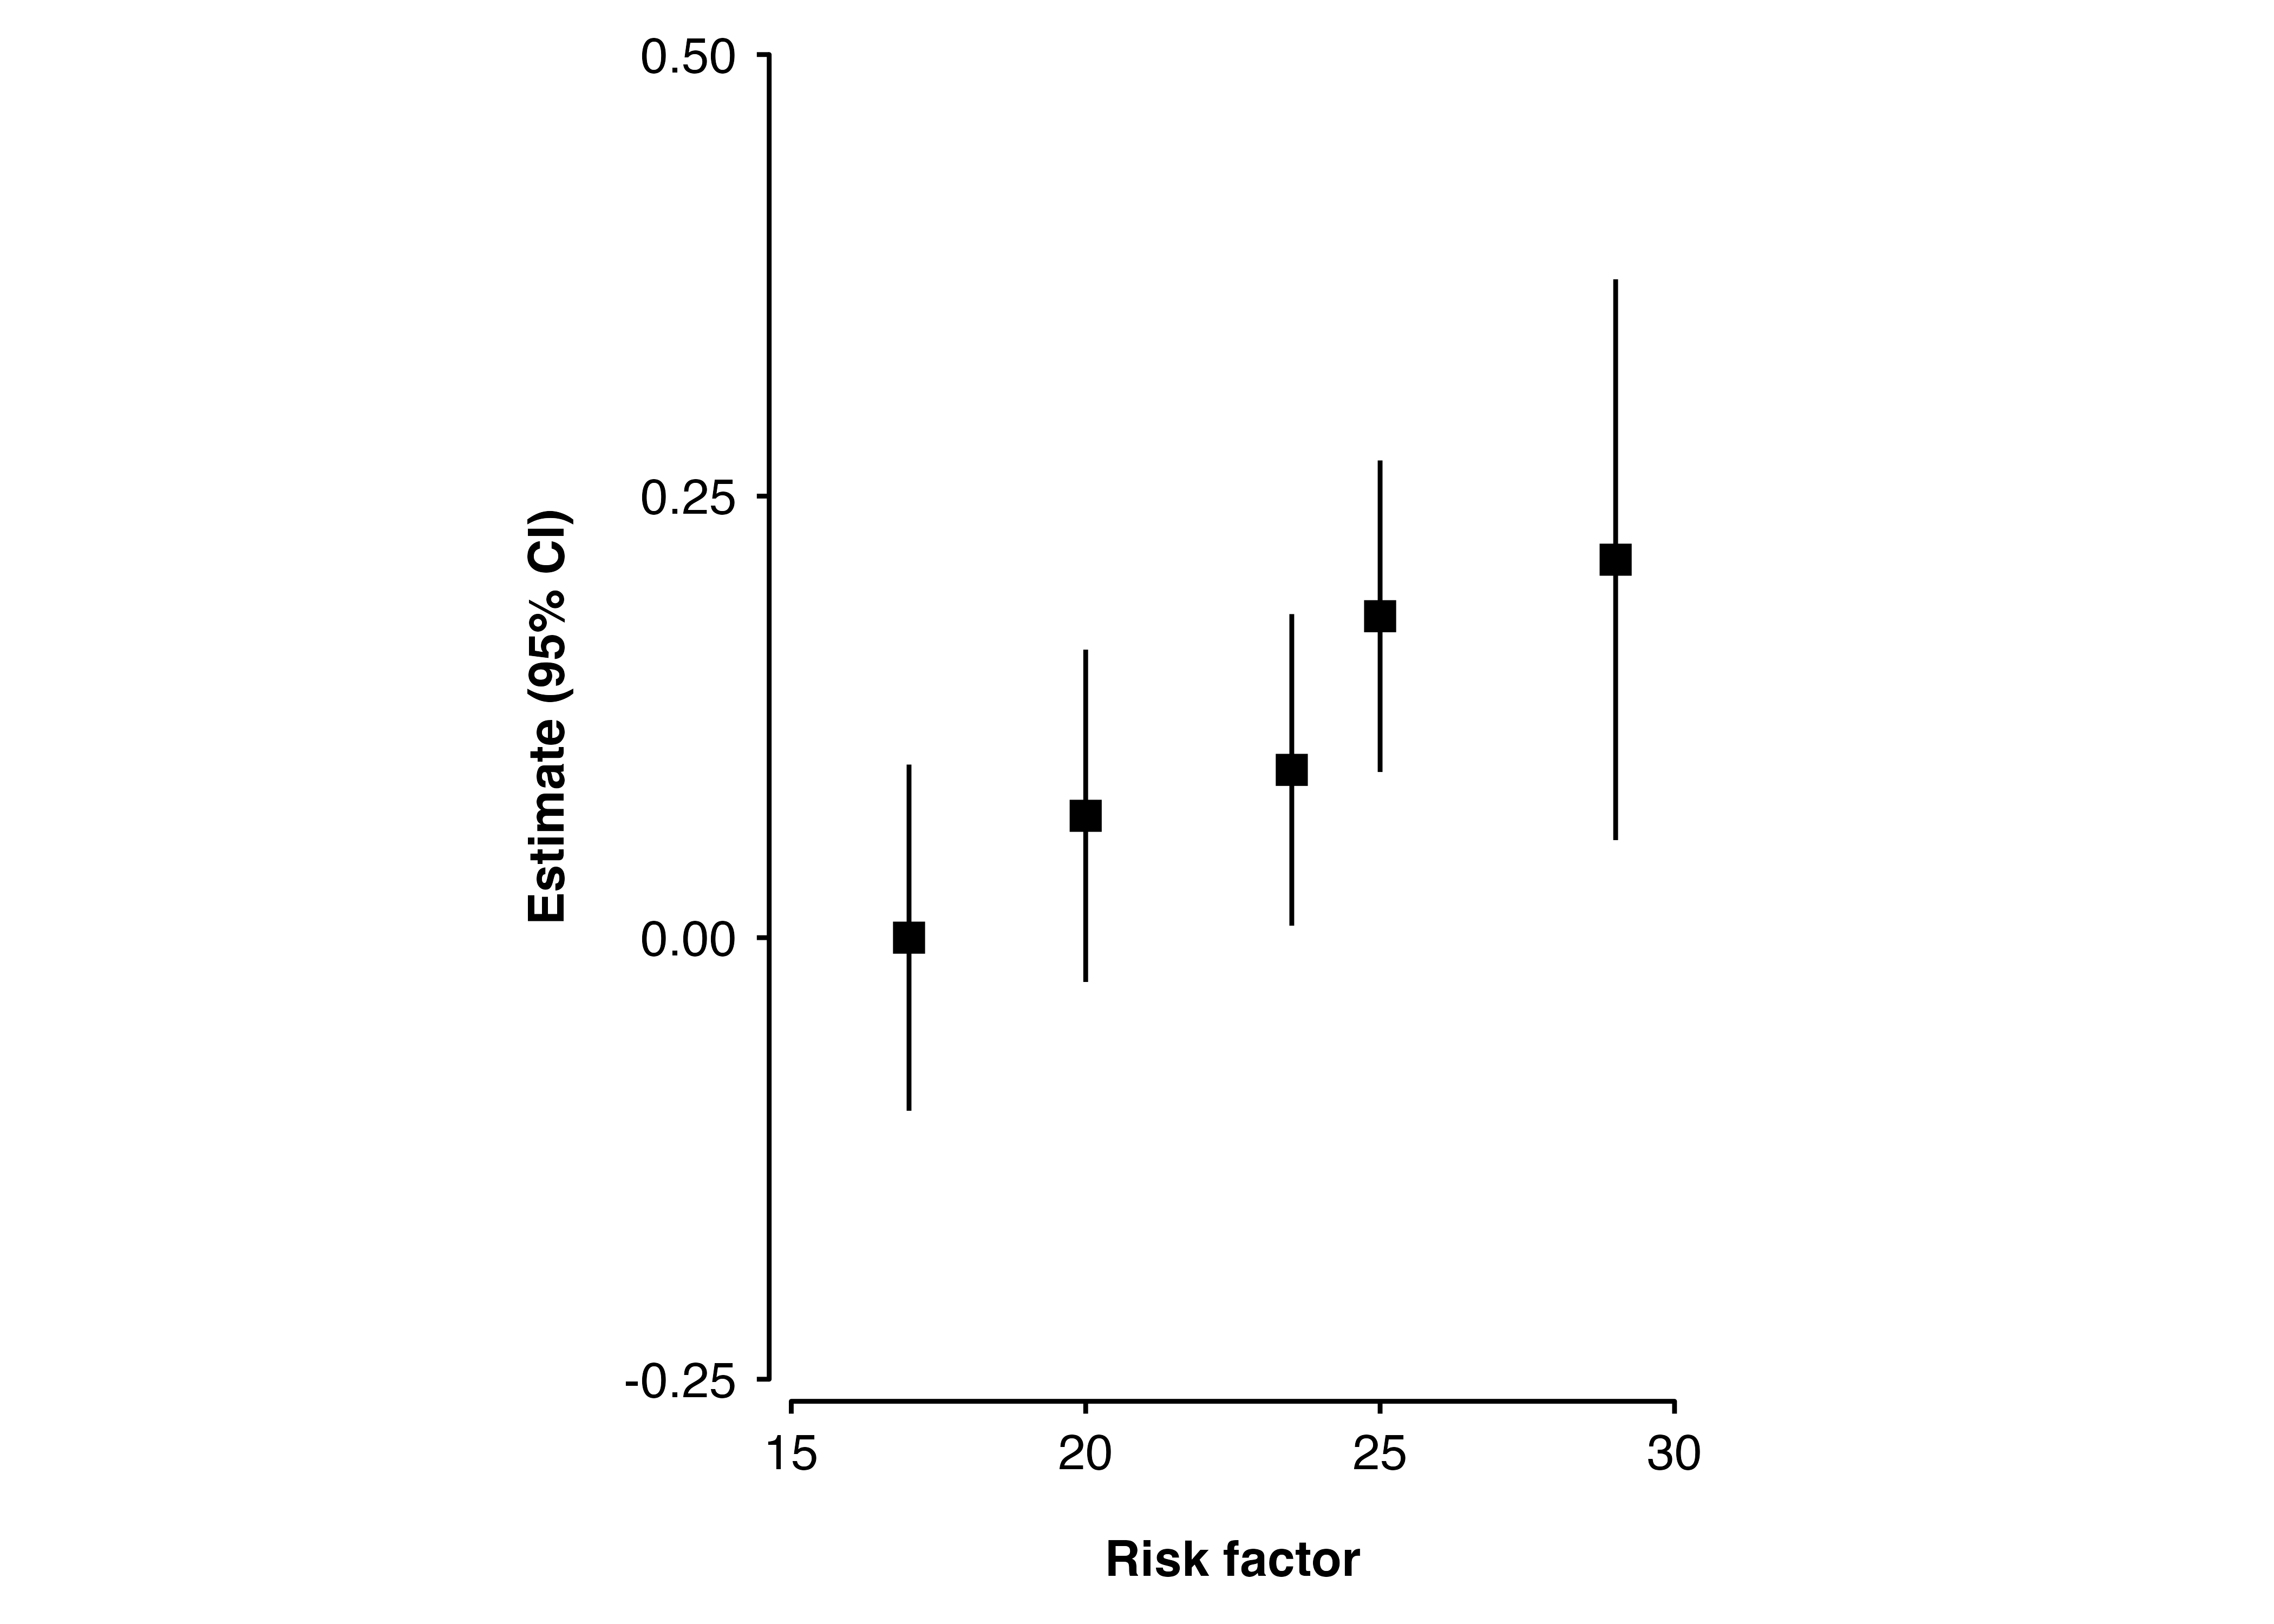
<- data.frame (risk_factor = c ( 17 , 20 , 23.5 , 25 , 29 ),est = c ( 0 , 0.069 , 0.095 , 0.182 , 0.214 ),se = c (0.05 , 0.048 , 0.045 , 0.045 , 0.081 )shape_plot (my_results,col.x = "risk_factor" ,xlims = c (15 , 30 ),ylims = c (- 0.25 , 0.5 ),add = list (estimates.text = list ()))
Remove text by setting label to NA
shape_plot (my_results,col.x = "risk_factor" ,xlims = c (15 , 30 ),ylims = c (- 0.25 , 0.5 ),addaes = list (estimates = "label = NA" ))
You could also set x or y to NA_real_.
Remove points by replacing the layer
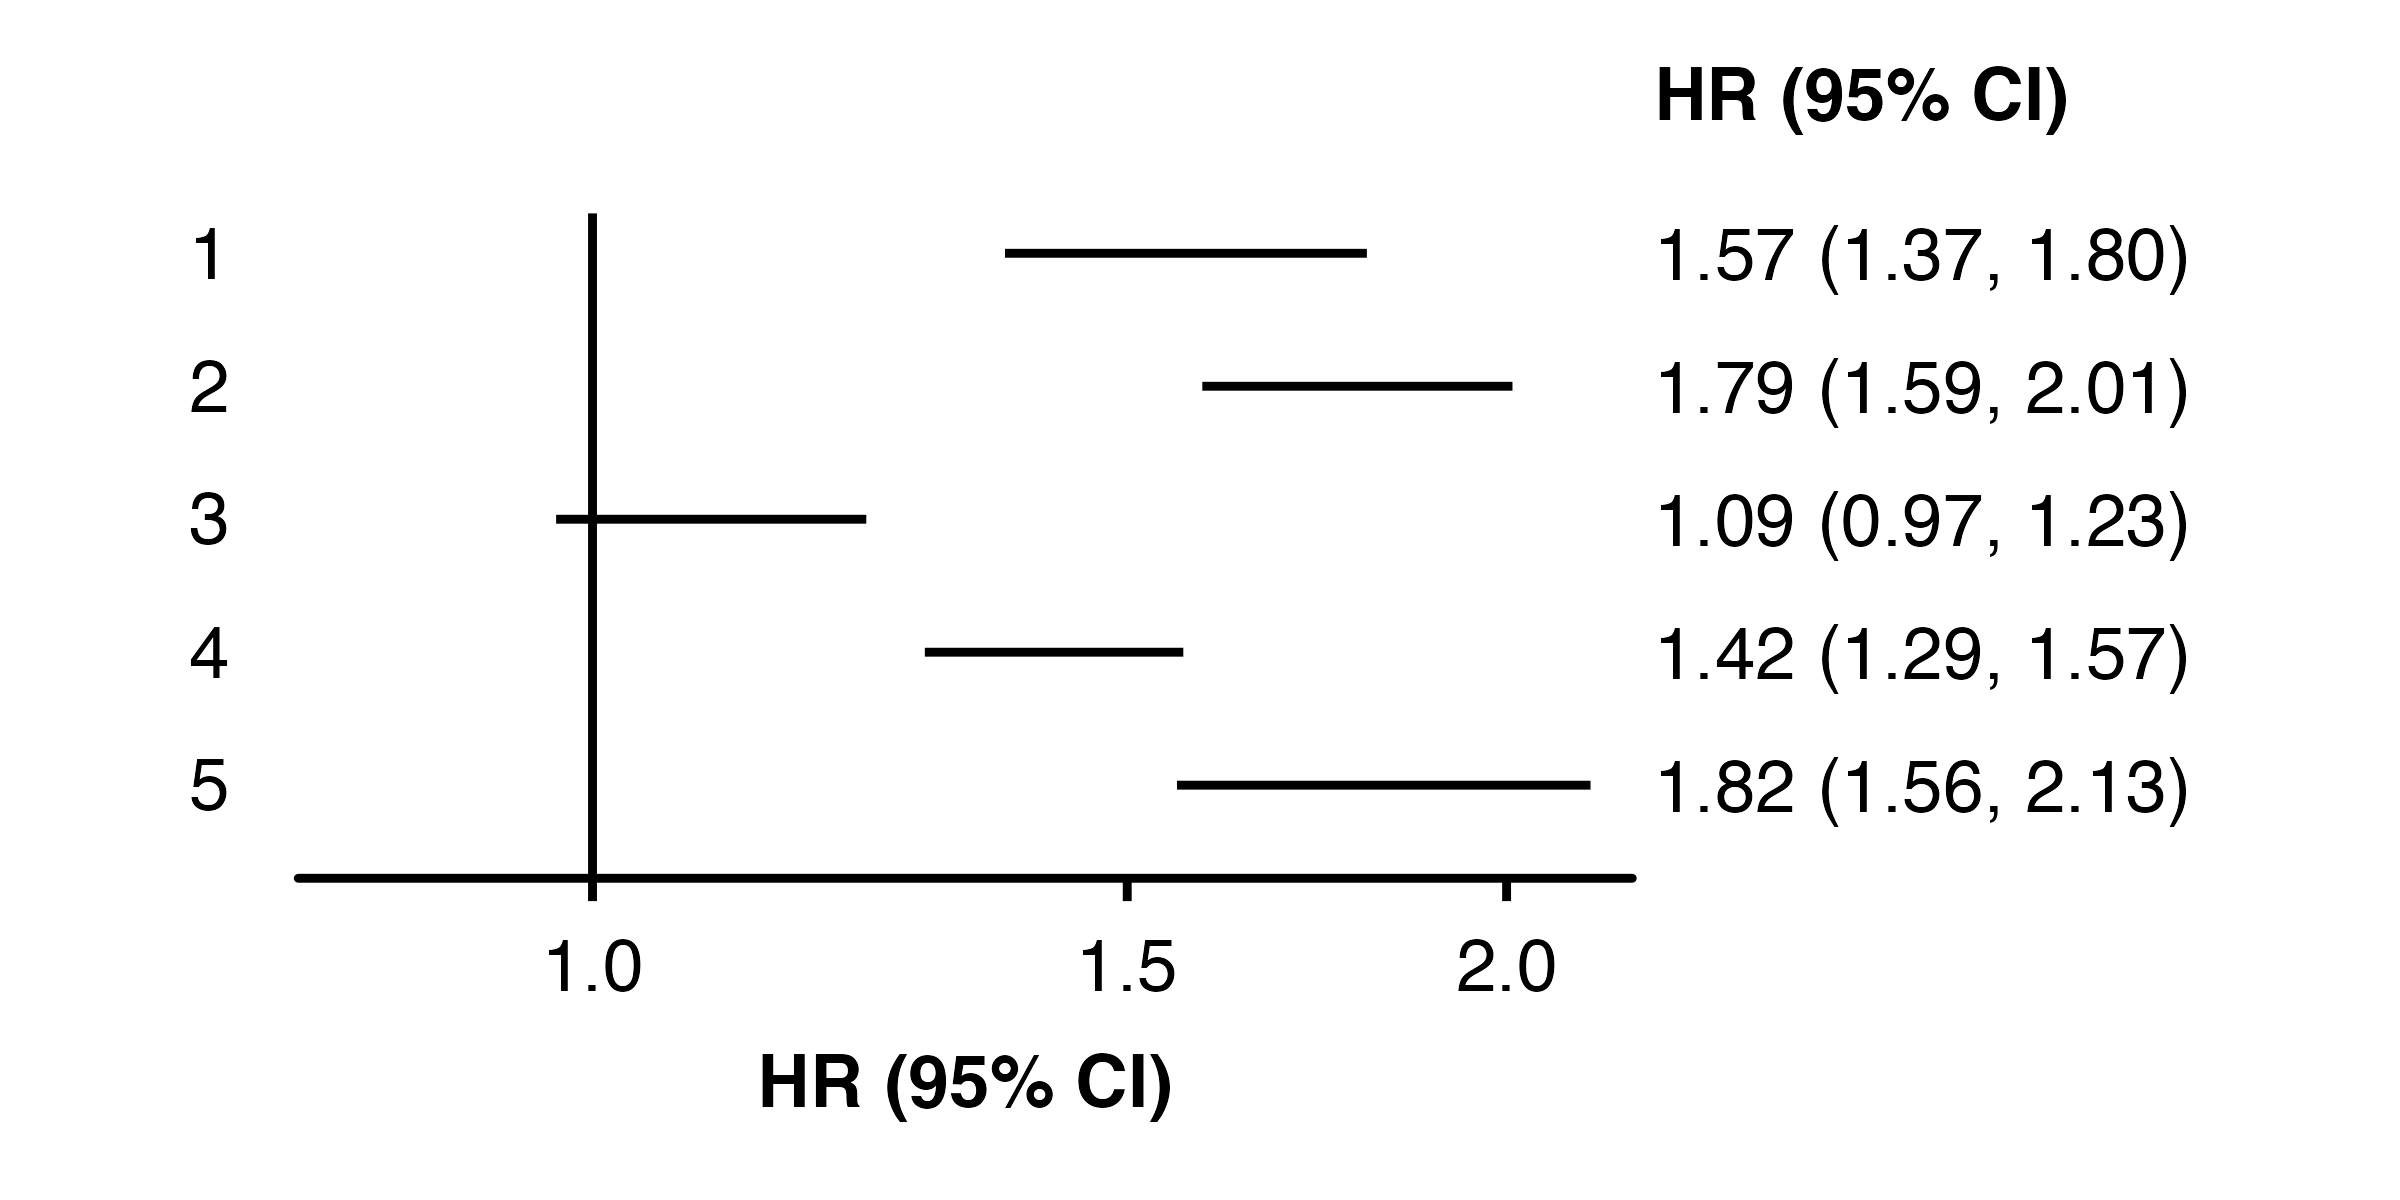
<- data.frame (subgroup = c ("men" , "women" , "35_49" , "50_64" , "65_79" ),est = c ( 0.45 , 0.58 , 0.09 , 0.35 , 0.6 ),se = c ( 0.07 , 0.06 , 0.06 , 0.05 , 0.08 )forest_plot (my_results,add = list (points = list ()))
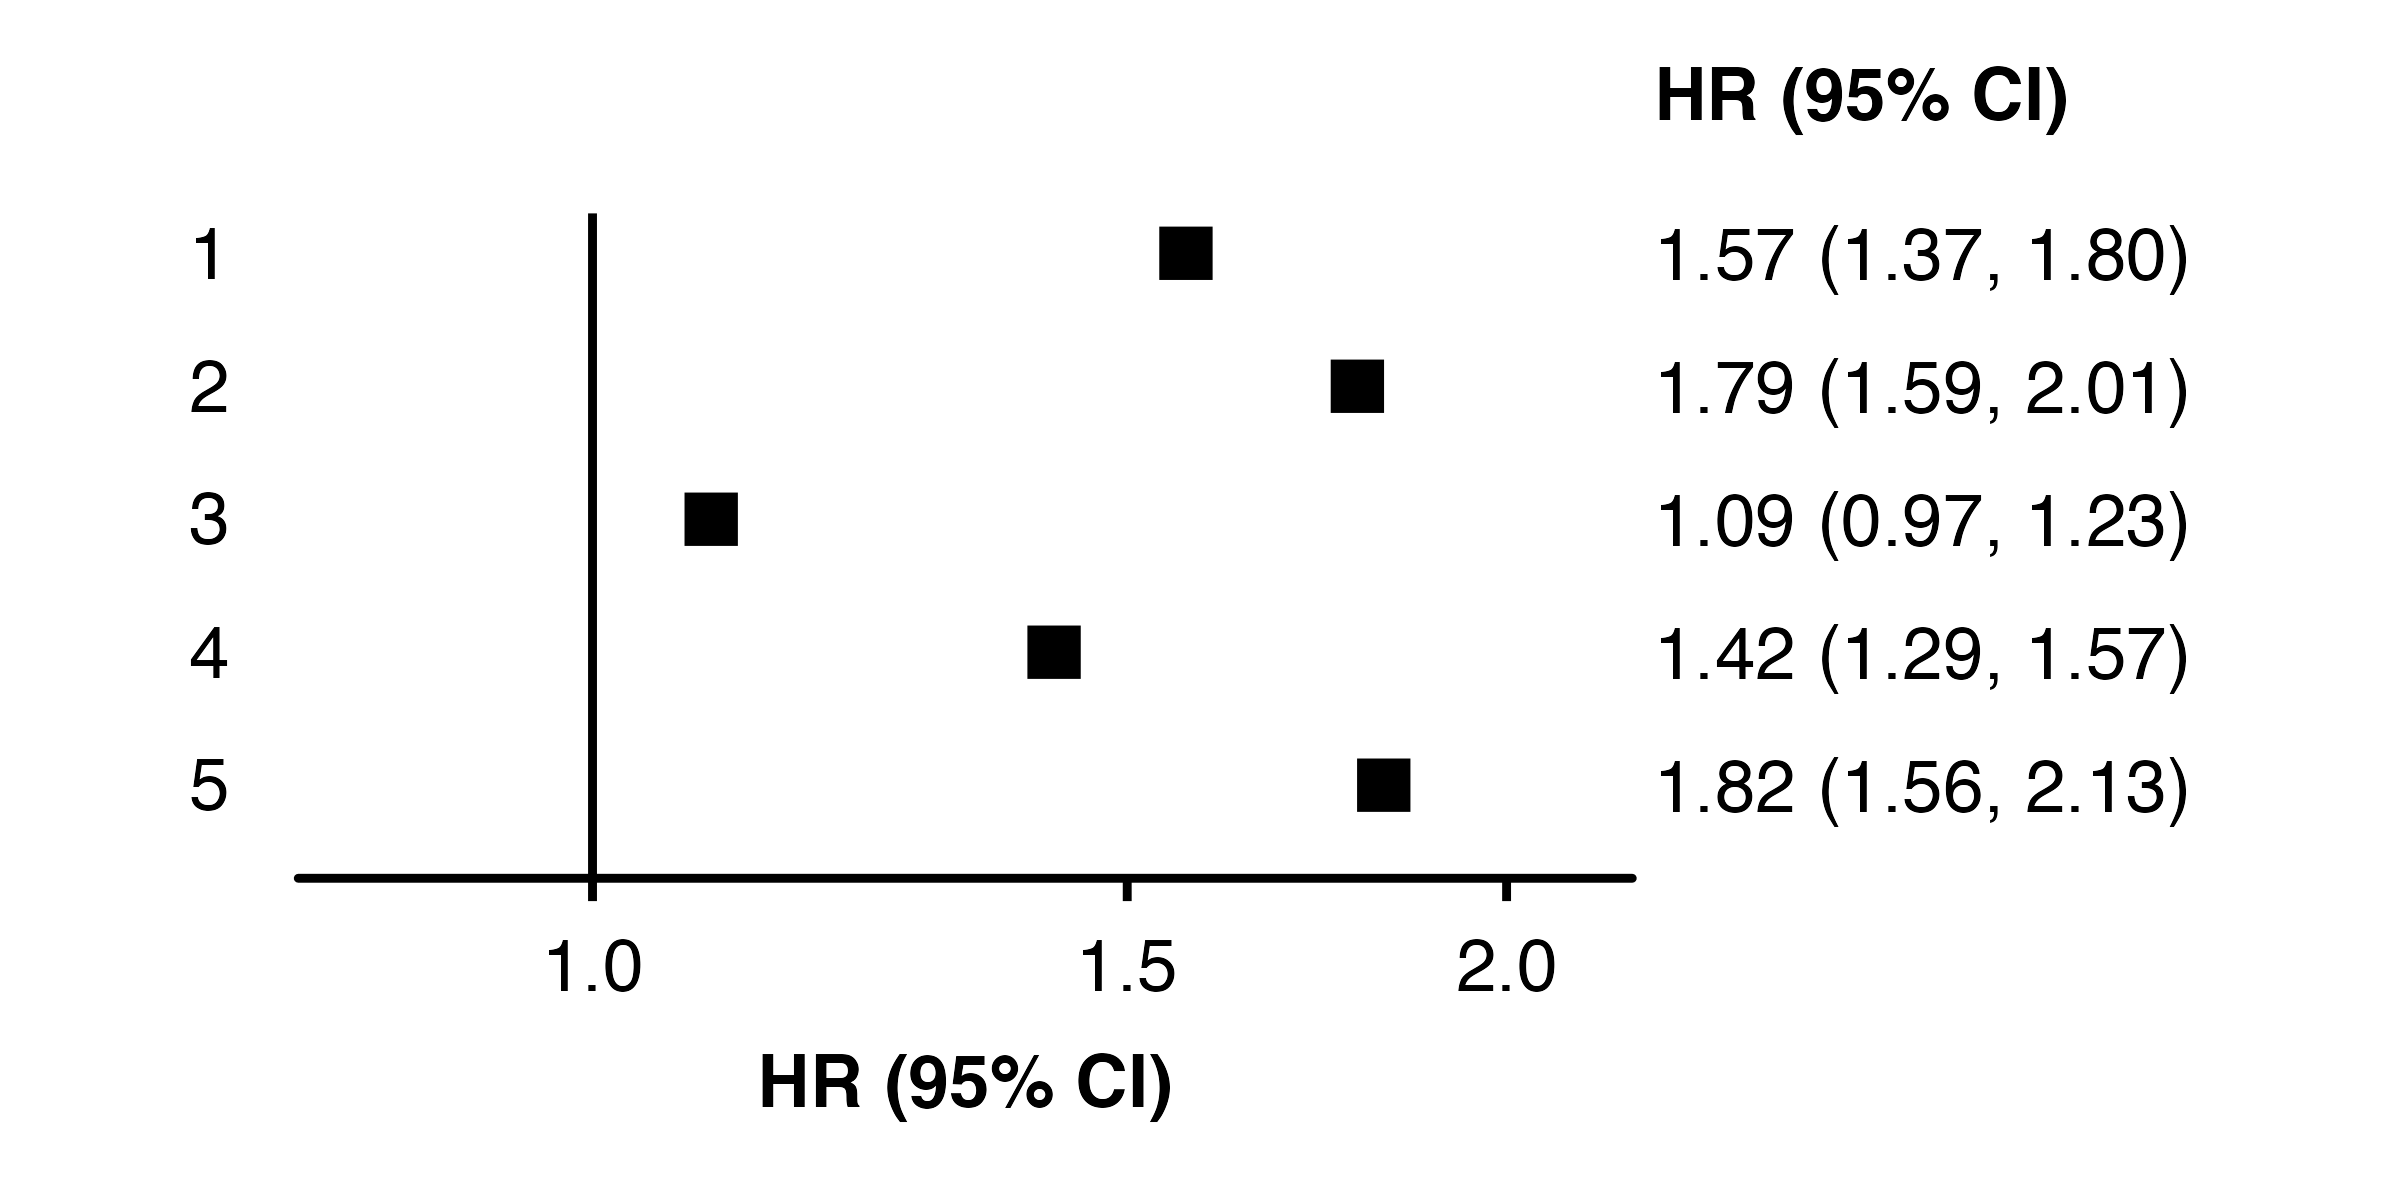
Remove points by setting their colour to NA
forest_plot (my_results,colour = NA ,cicolour = "black" )
Remove points by setting their size to zero
forest_plot (my_results,pointsize = 0 )
Remove confidence interval lines by setting their colour to NA
forest_plot (my_results,cicolour = NA )