shape_plot(my_results,
           col.x = "risk_factor",
           col.group = "group",
           exponentiate = TRUE,
           ciunder = TRUE,
           xlim = c(0.5, 5.5),
           base_size = 8)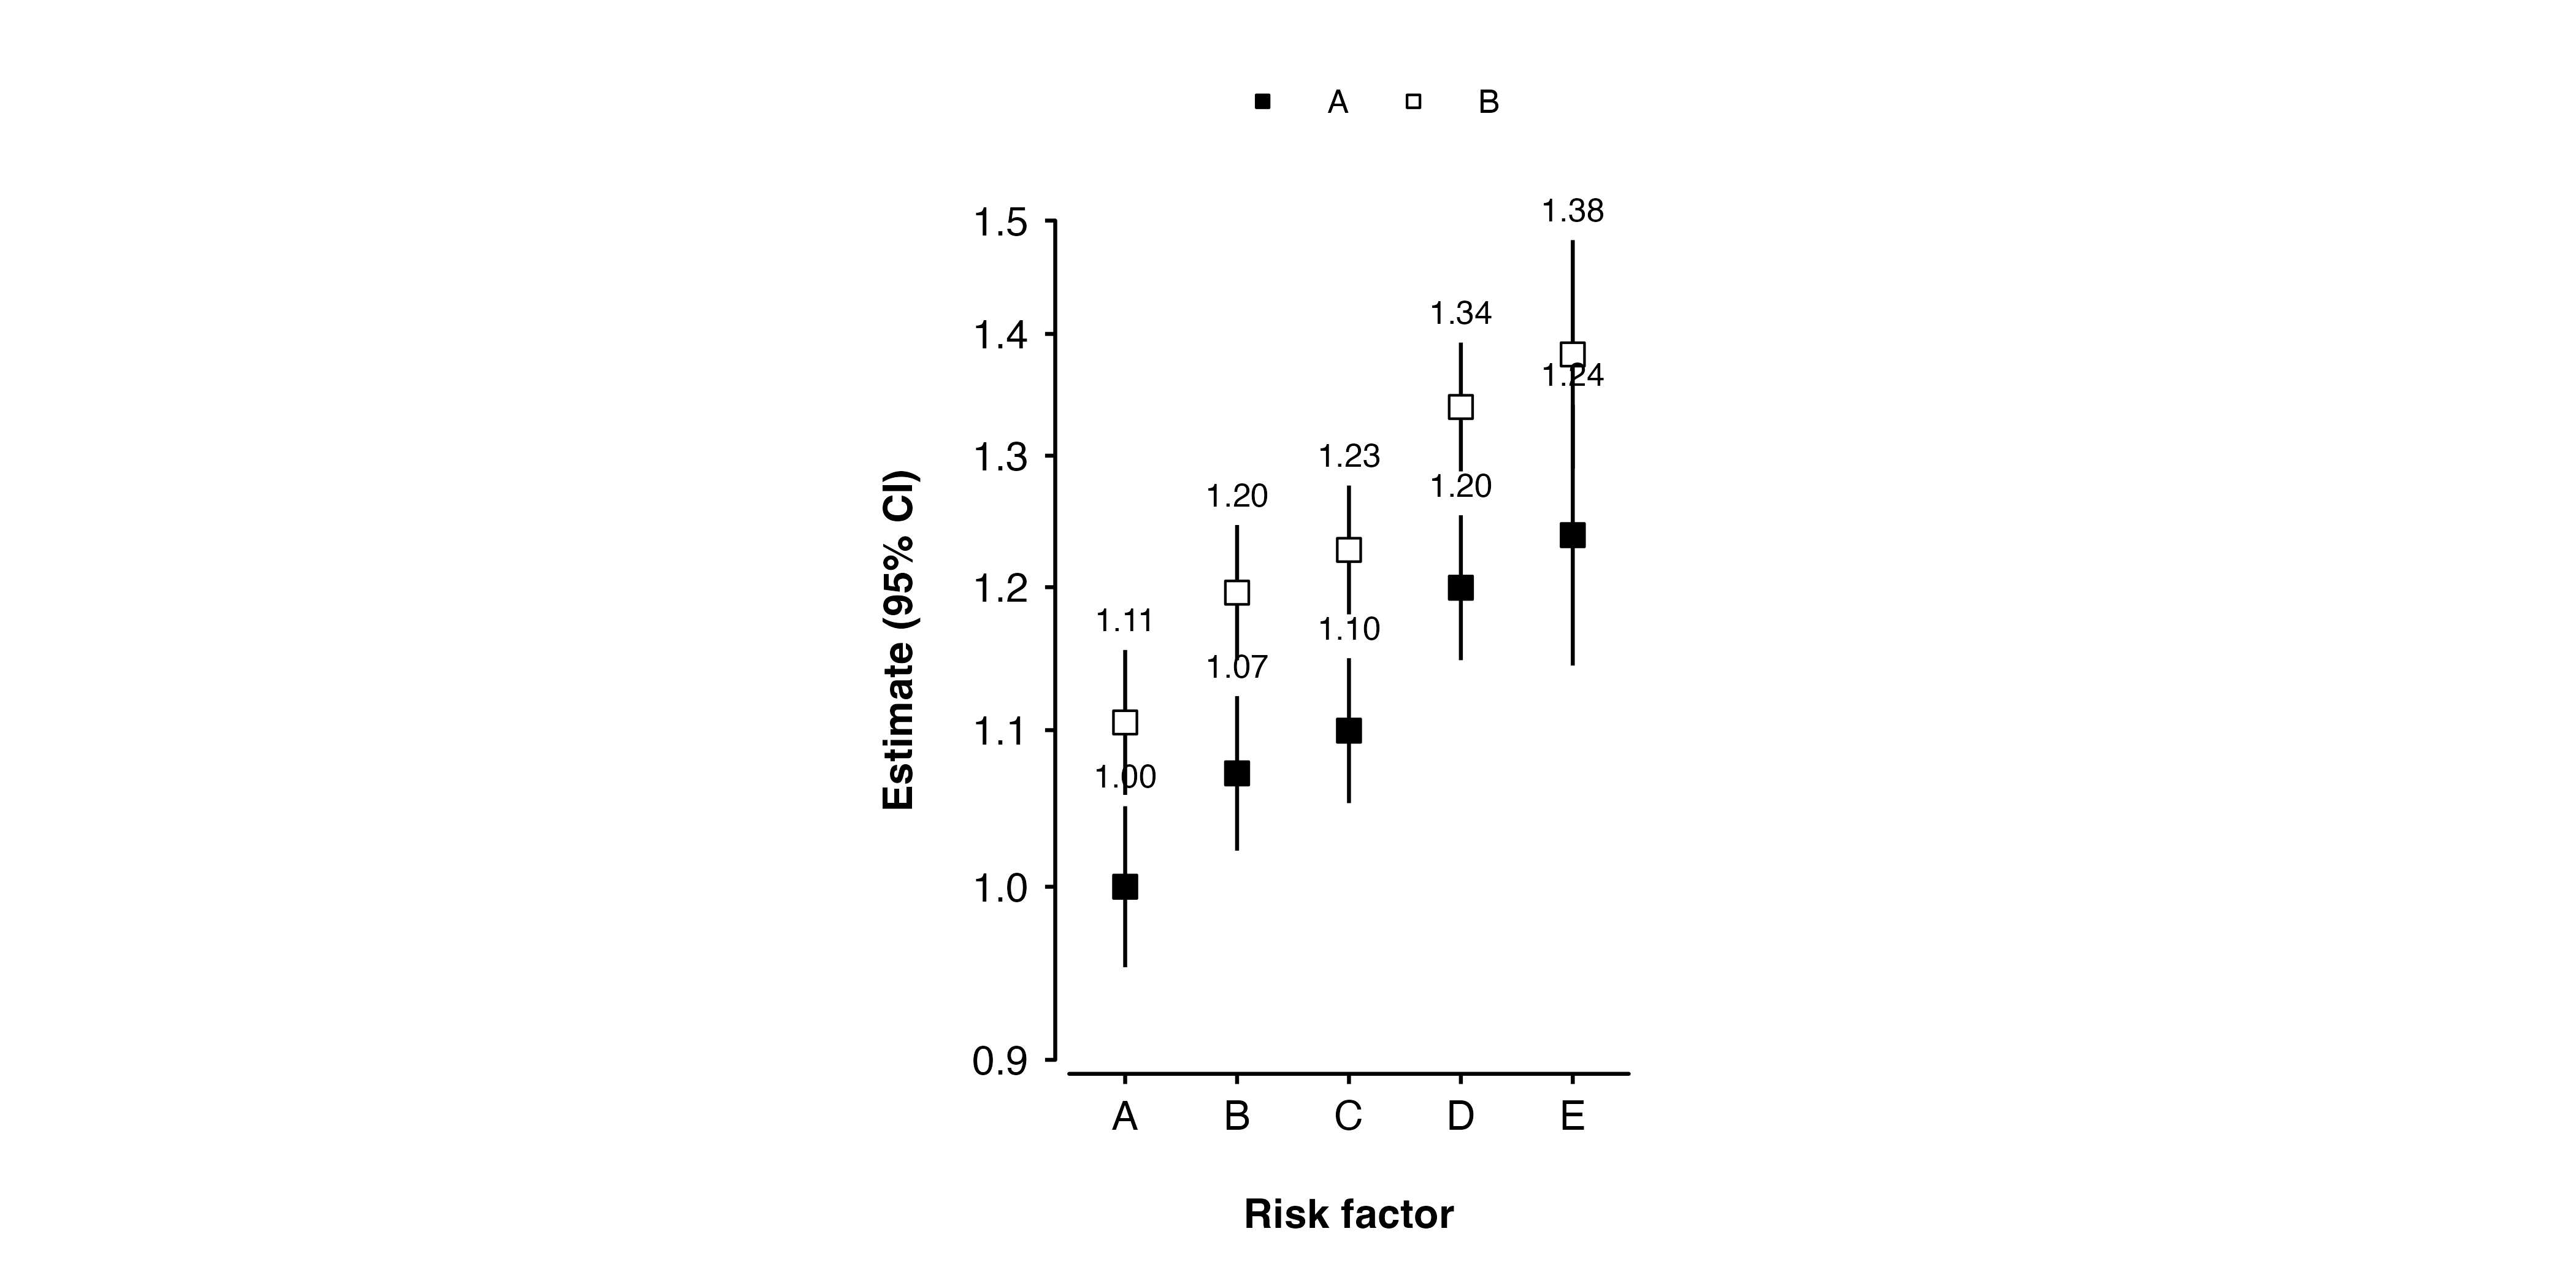
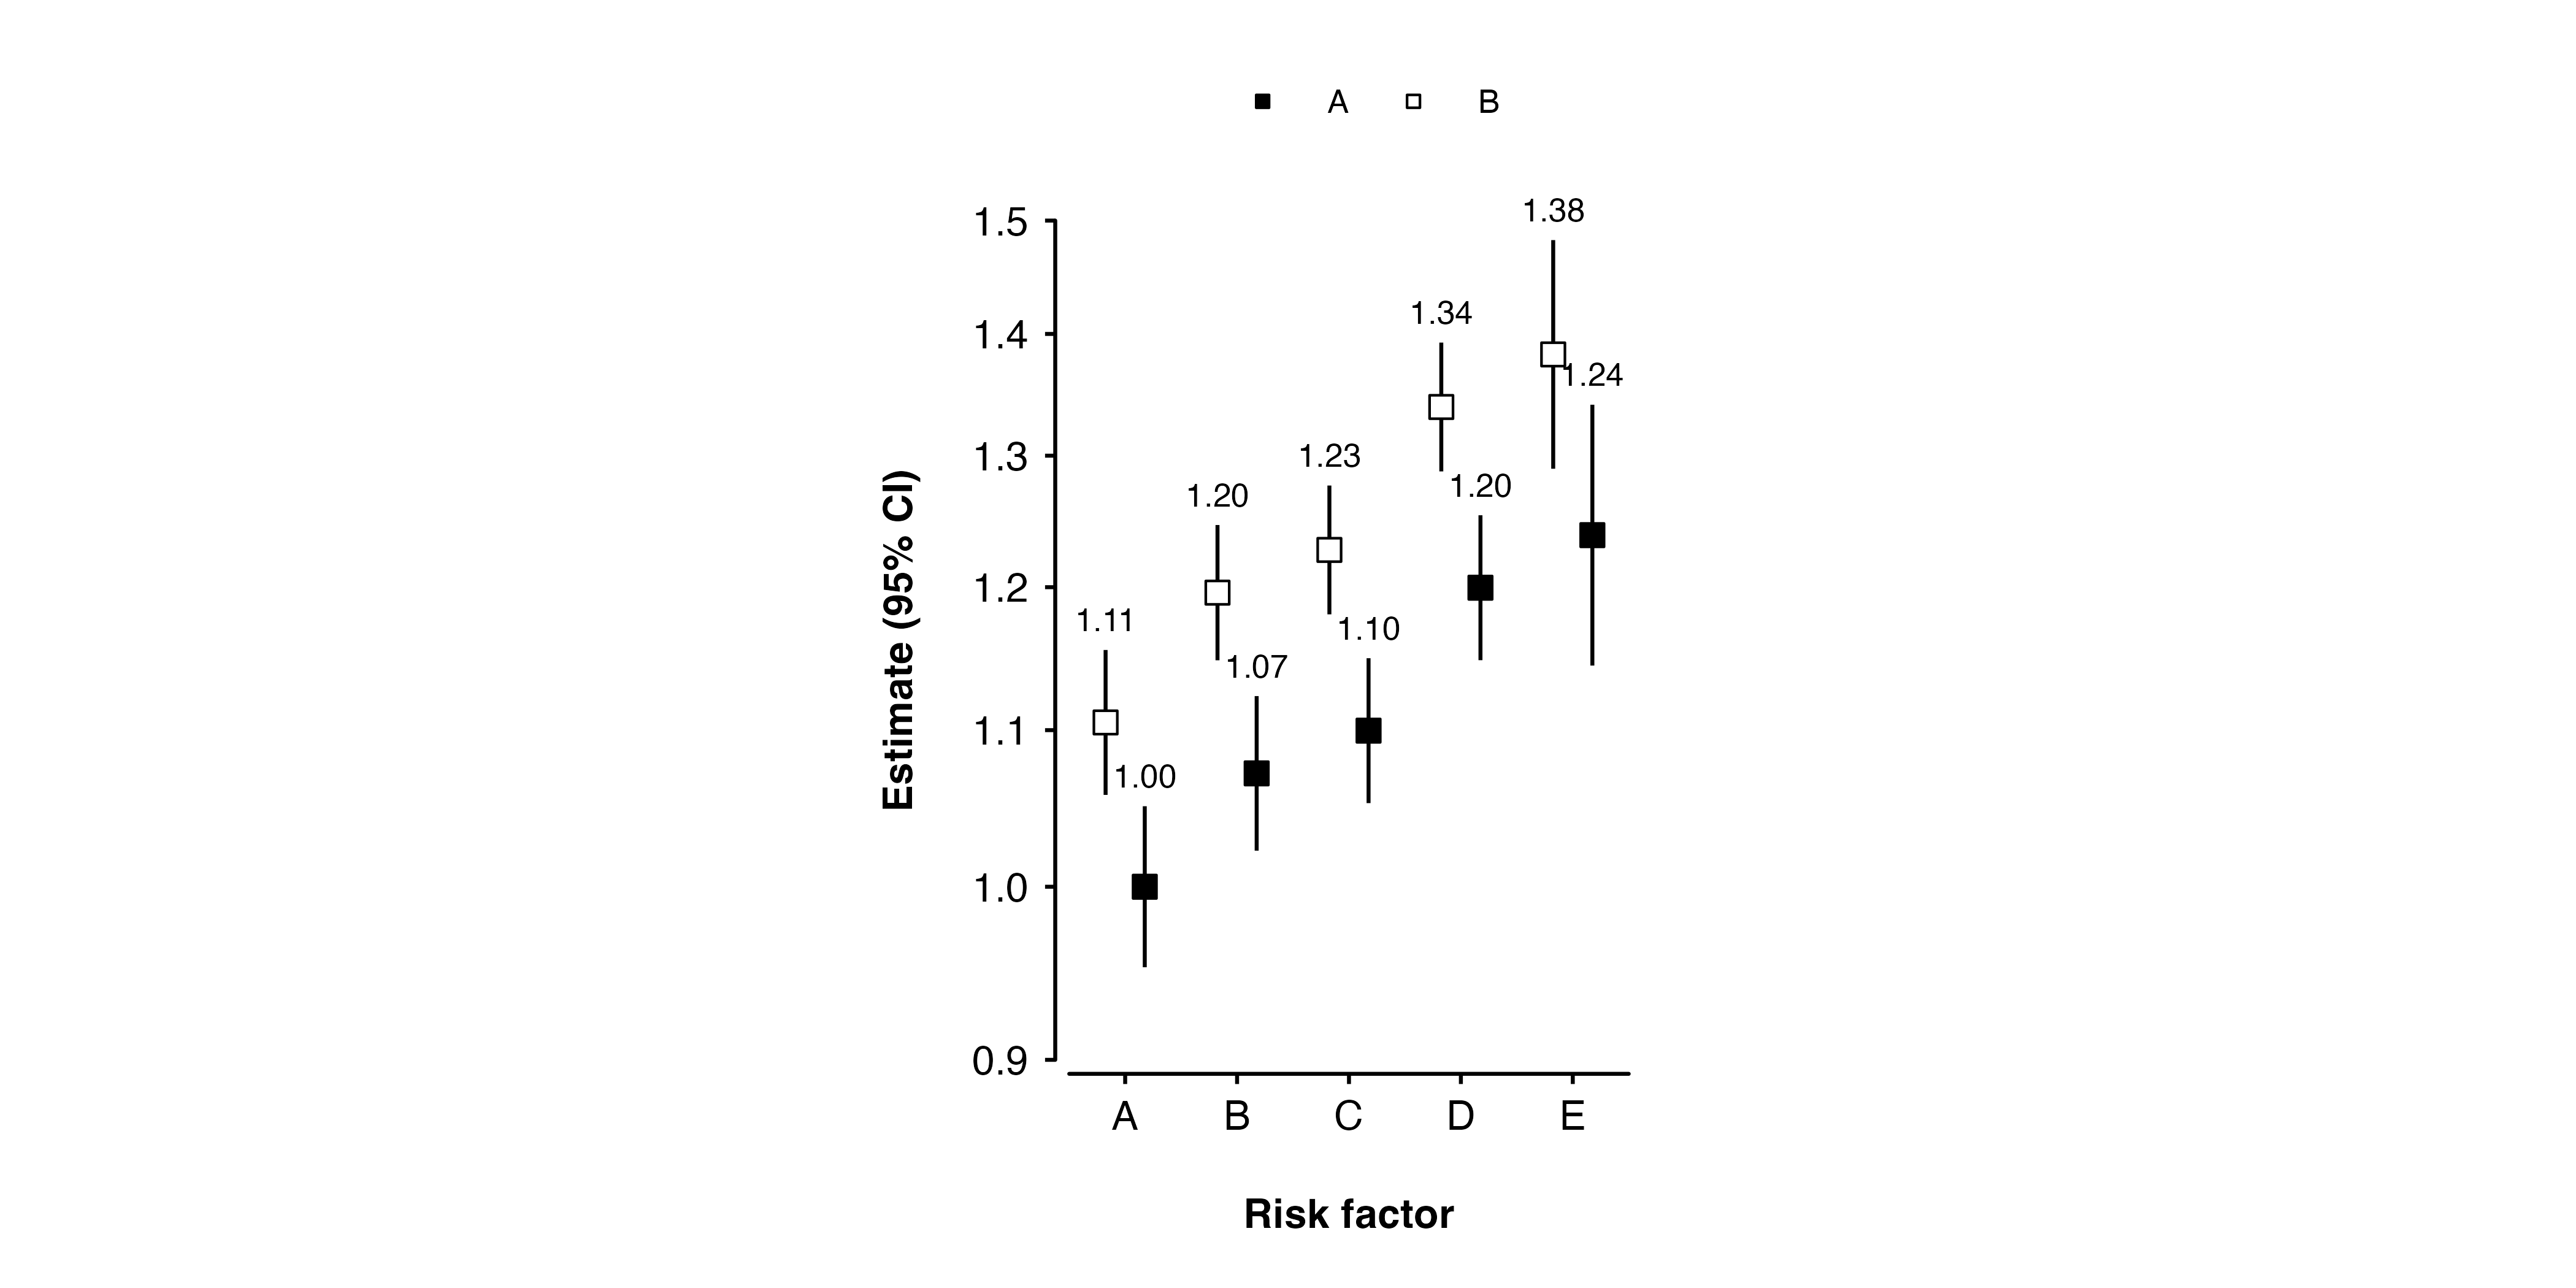
When groups are plotted with shape_plot(), points, confidence interval lines, and text can be cluttered or overlap.
shape_plot(my_results,
col.x = "risk_factor",
col.group = "group",
exponentiate = TRUE,
ciunder = TRUE,
xlim = c(0.5, 5.5),
base_size = 8)
One approach to avoid this is to slightly adjust the x position values that are used. Another approach is to add position arguments, and this is suitable when the risk factor is a factor.
This example adds the same position argument to estimates.points, ci, and estimates.text, using position_dodge() to move them all to the left or right.
position_adjust <- "position = position_dodge(width = 0.7, reverse = TRUE)"

shape_plot(my_results,
           col.x = "risk_factor",
           col.group = "group",
           exponentiate = TRUE,
           ciunder = TRUE,
           xlim = c(0.5, 5.5),
           base_size = 8,
           addarg = list(estimates.points = position_adjust,
                         ci = position_adjust,
                         estimates.text = position_adjust))