custom_fill_scale <- scale_fill_manual(name = "",
values = c("Men" = "red",
"Women"= "blue"))
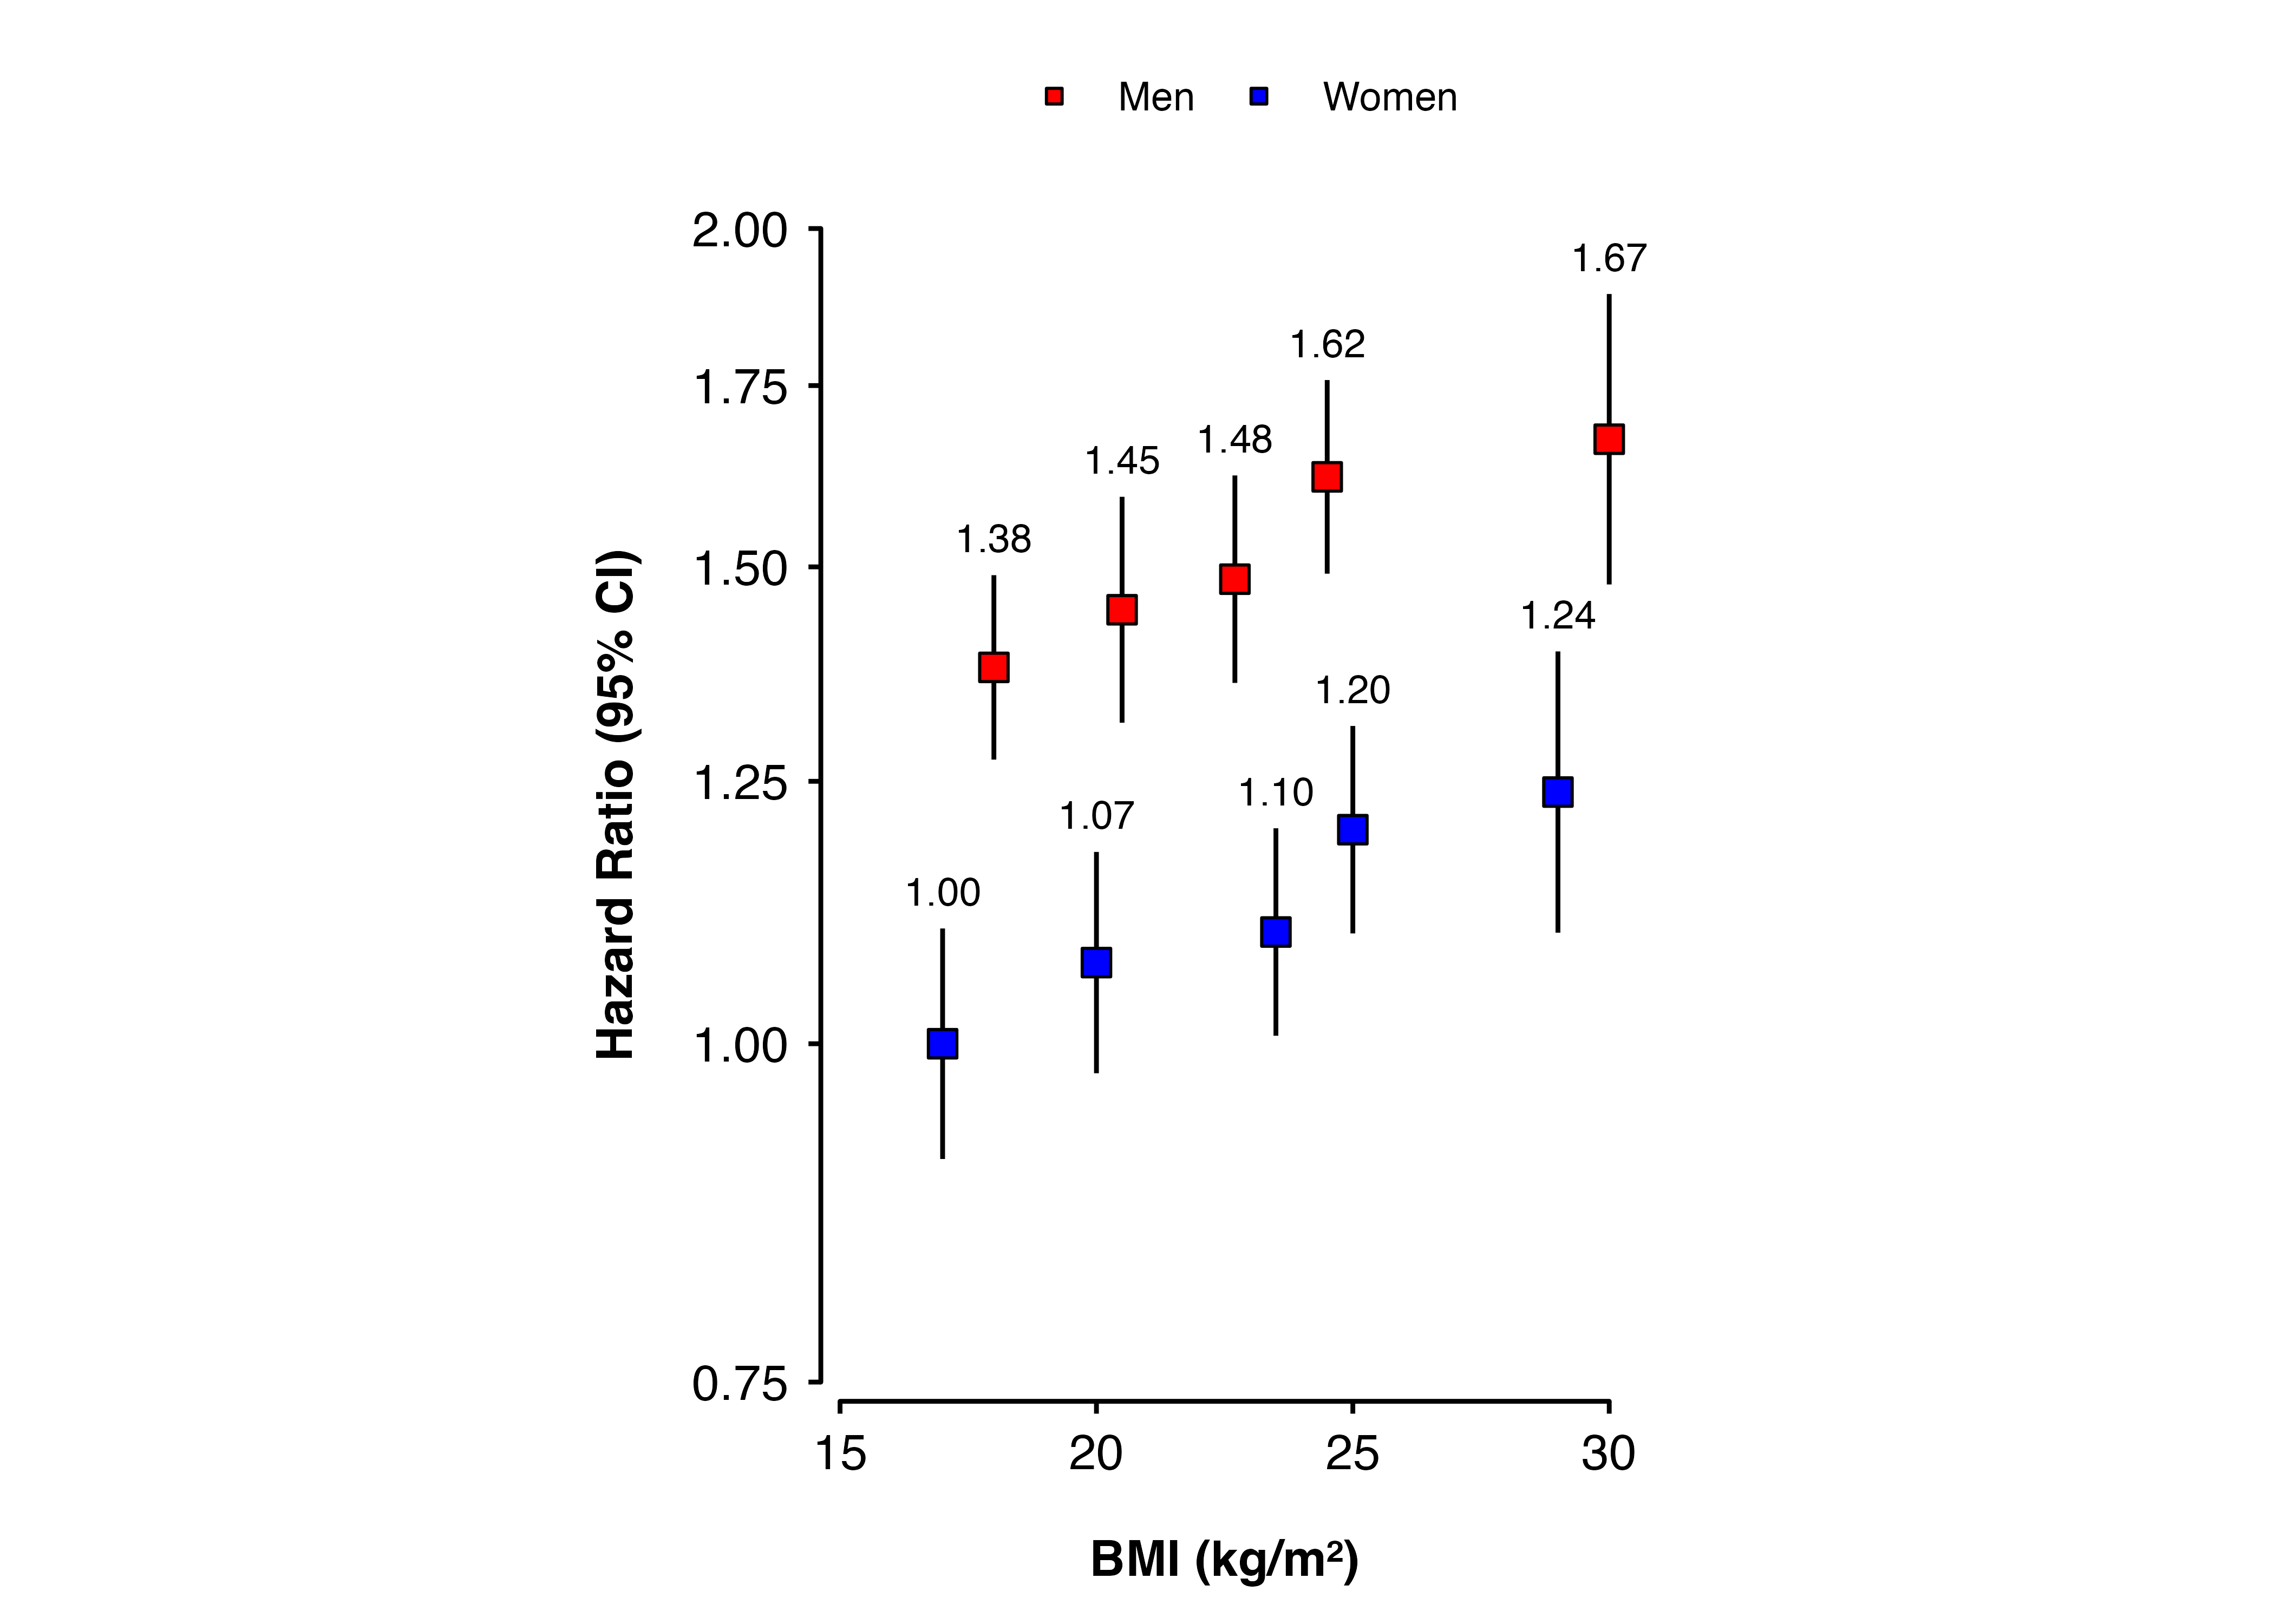
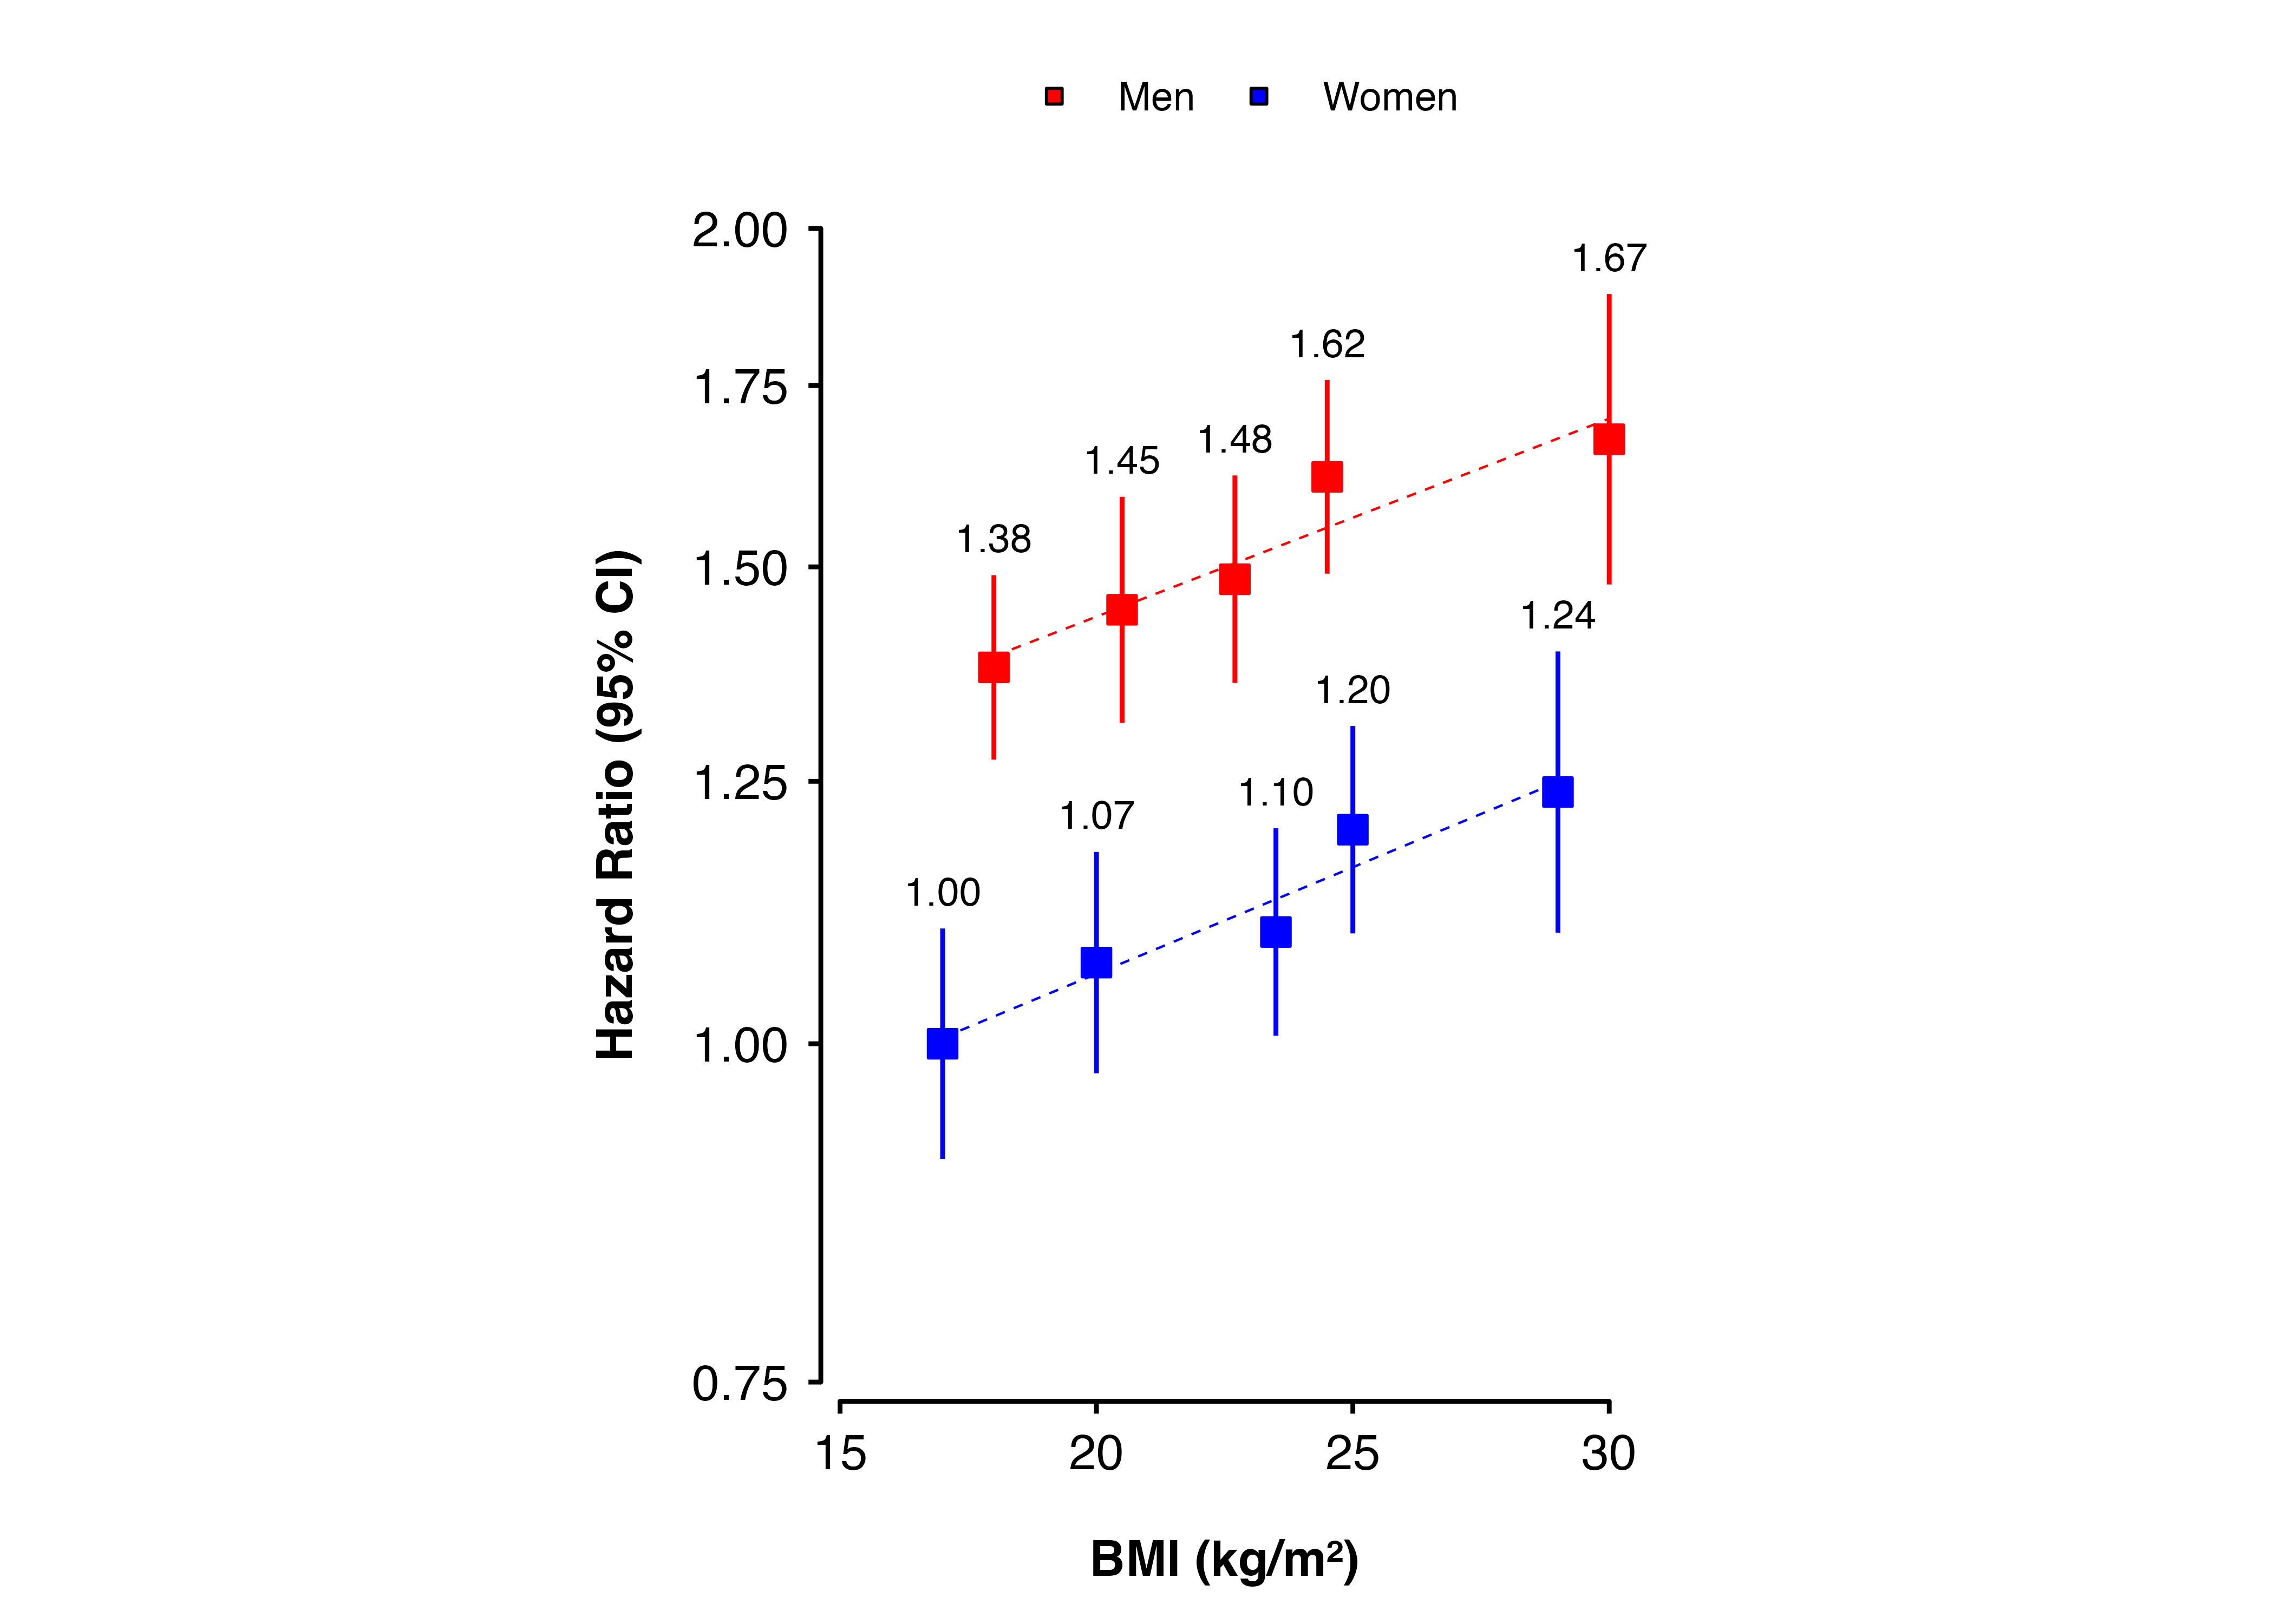
shape_plot(my_results,
col.x = "risk_factor",
xlims = c(15, 30),
ylims = c(0.75, 2),
exponentiate = TRUE,
xlab = "BMI (kg/m\u00B2)",
ylab = "Hazard Ratio (95% CI)",
col.group = "group",
ciunder = TRUE,
add = list(scale.fill = custom_fill_scale))