Annotate
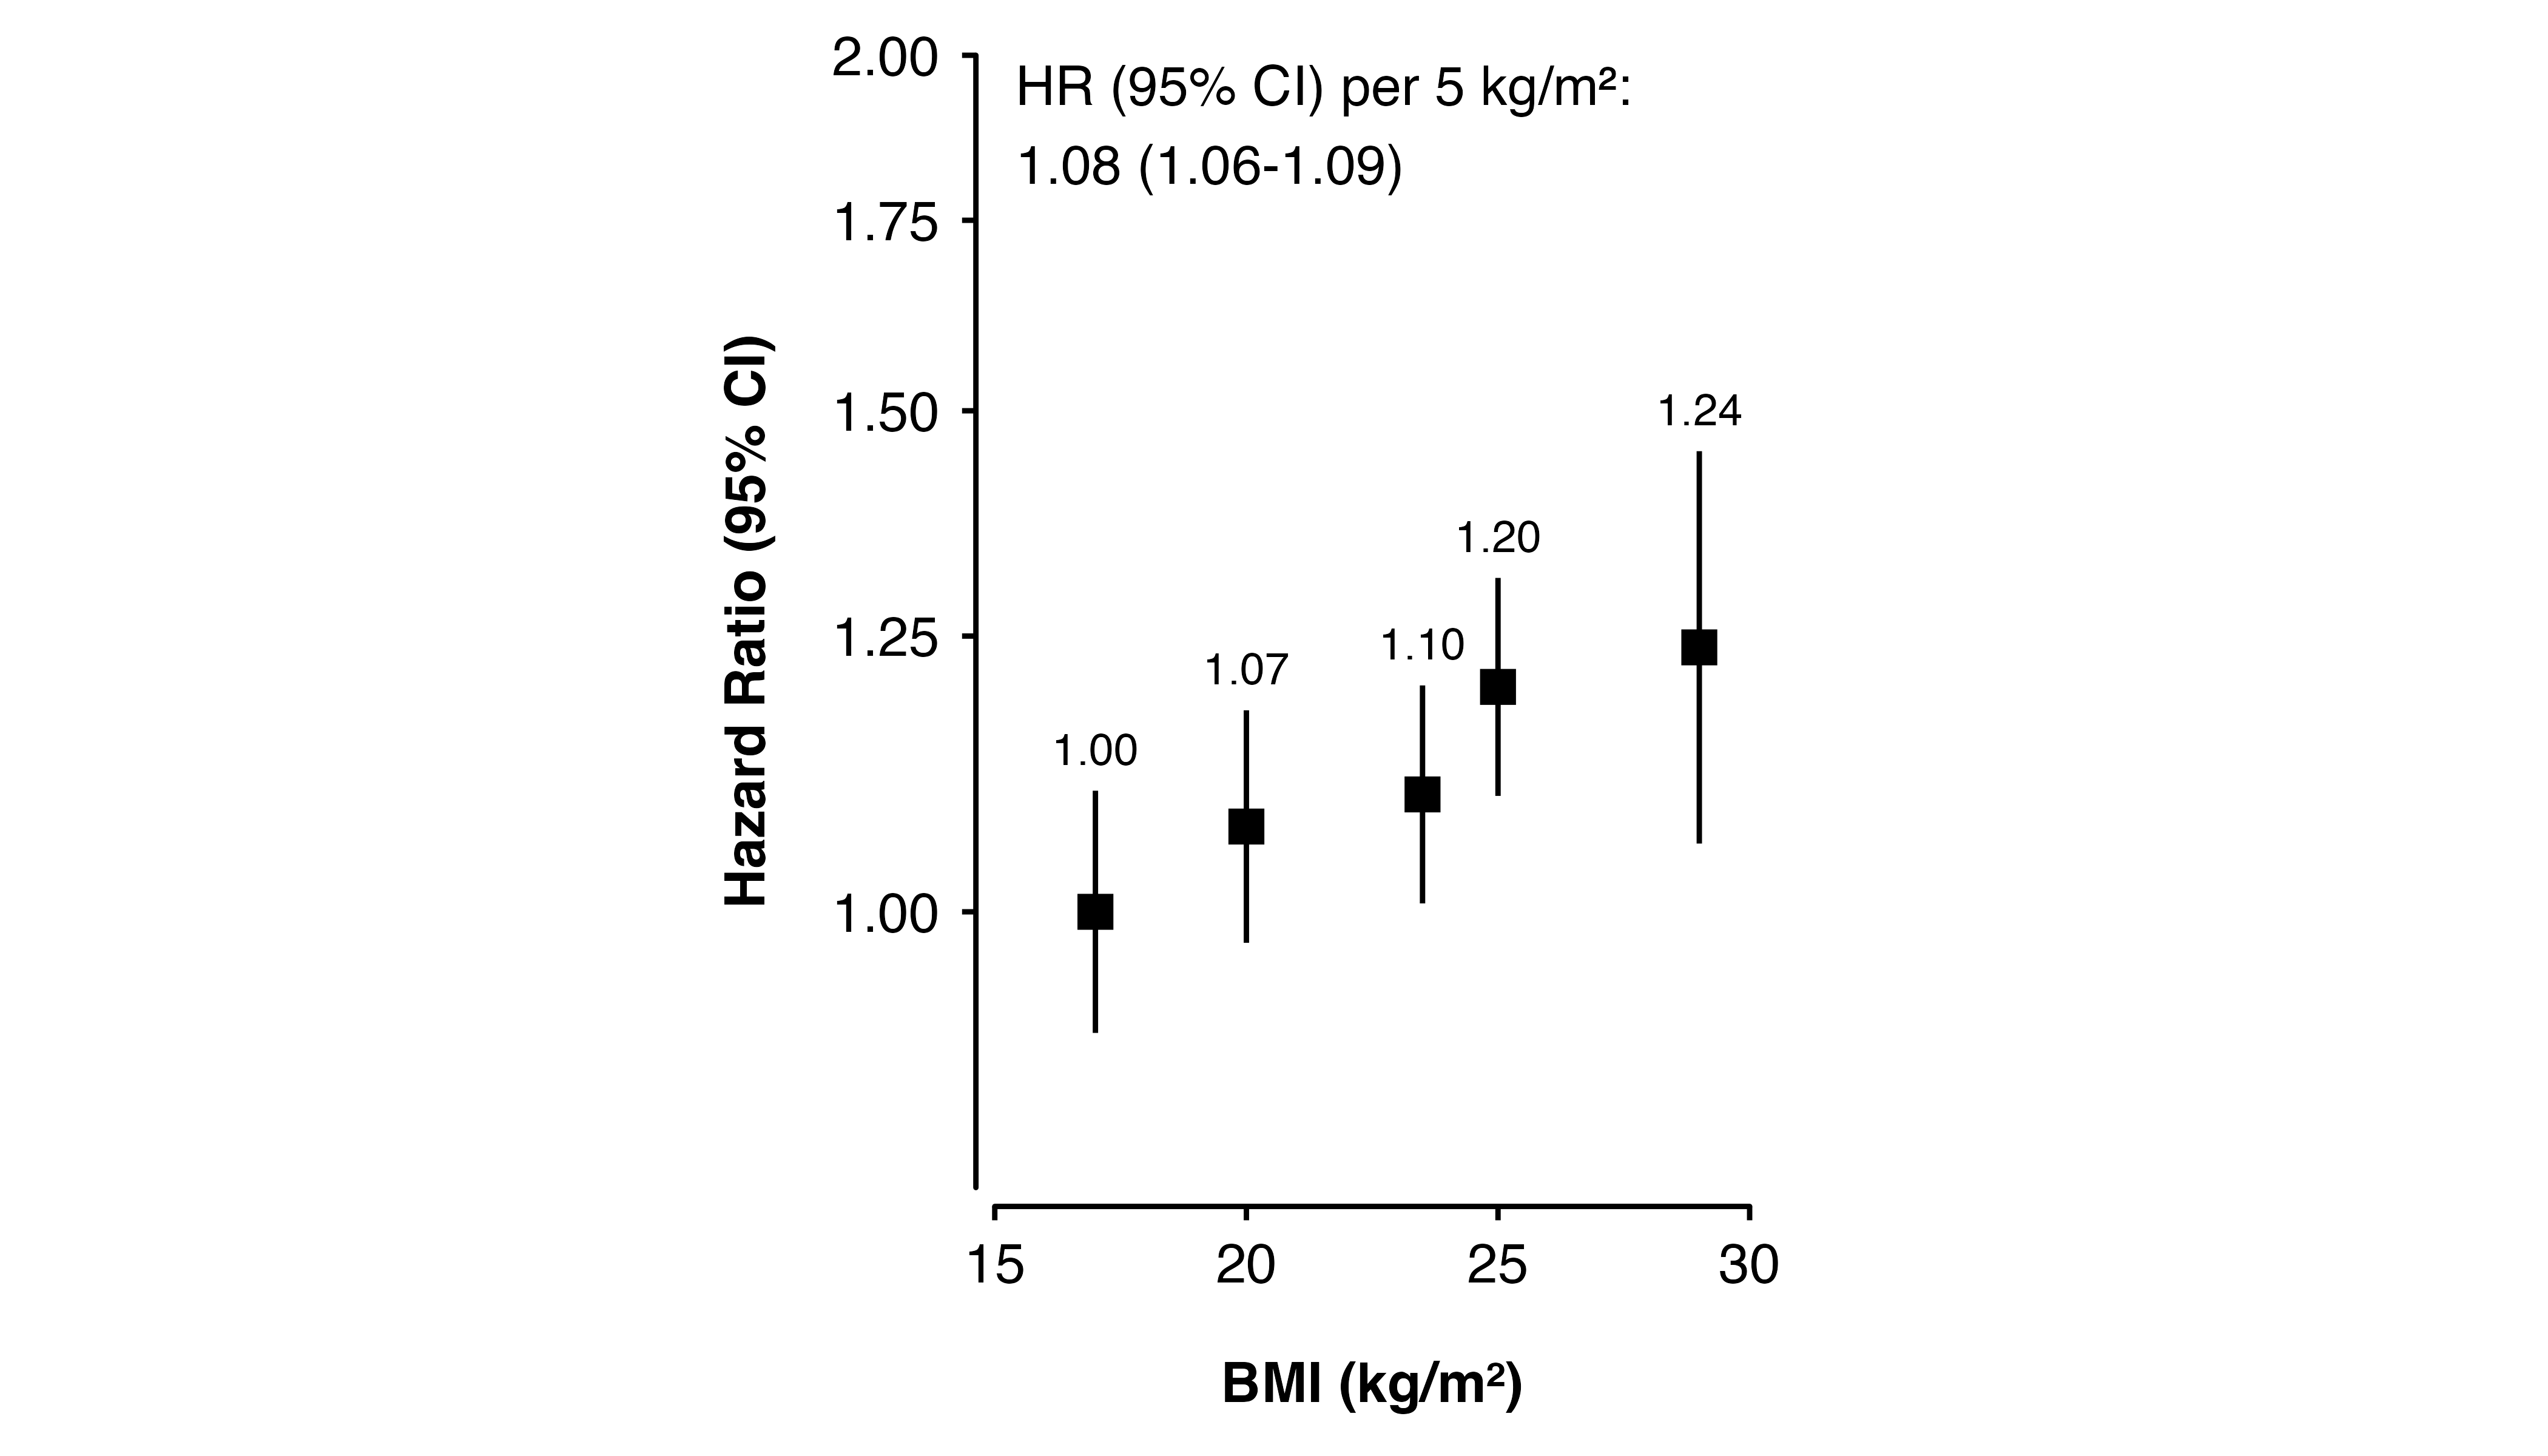
Annotation can be added to a shape plot using the annotate() function of ggplot2 with the add argument.
hr_text <- annotate(geom  = "text",
                    x     = I(0.05),
                    y     = I(0.975),
                    hjust = 0,
                    vjust = 1,
                    size  = 3.8,
                    label = "HR (95% CI) per 5 kg/m\u00B2:\n1.08 (1.06-1.09)")

shape_plot(my_results,
           col.x        = "risk_factor",
           exponentiate = TRUE,
           xlim         = c(15, 30),
           ylim         = c(0.8, 2),
           xlab         = "BMI (kg/m\u00B2)",
           ylab         = "Hazard Ratio (95% CI)",
           add          = list(start = hr_text))
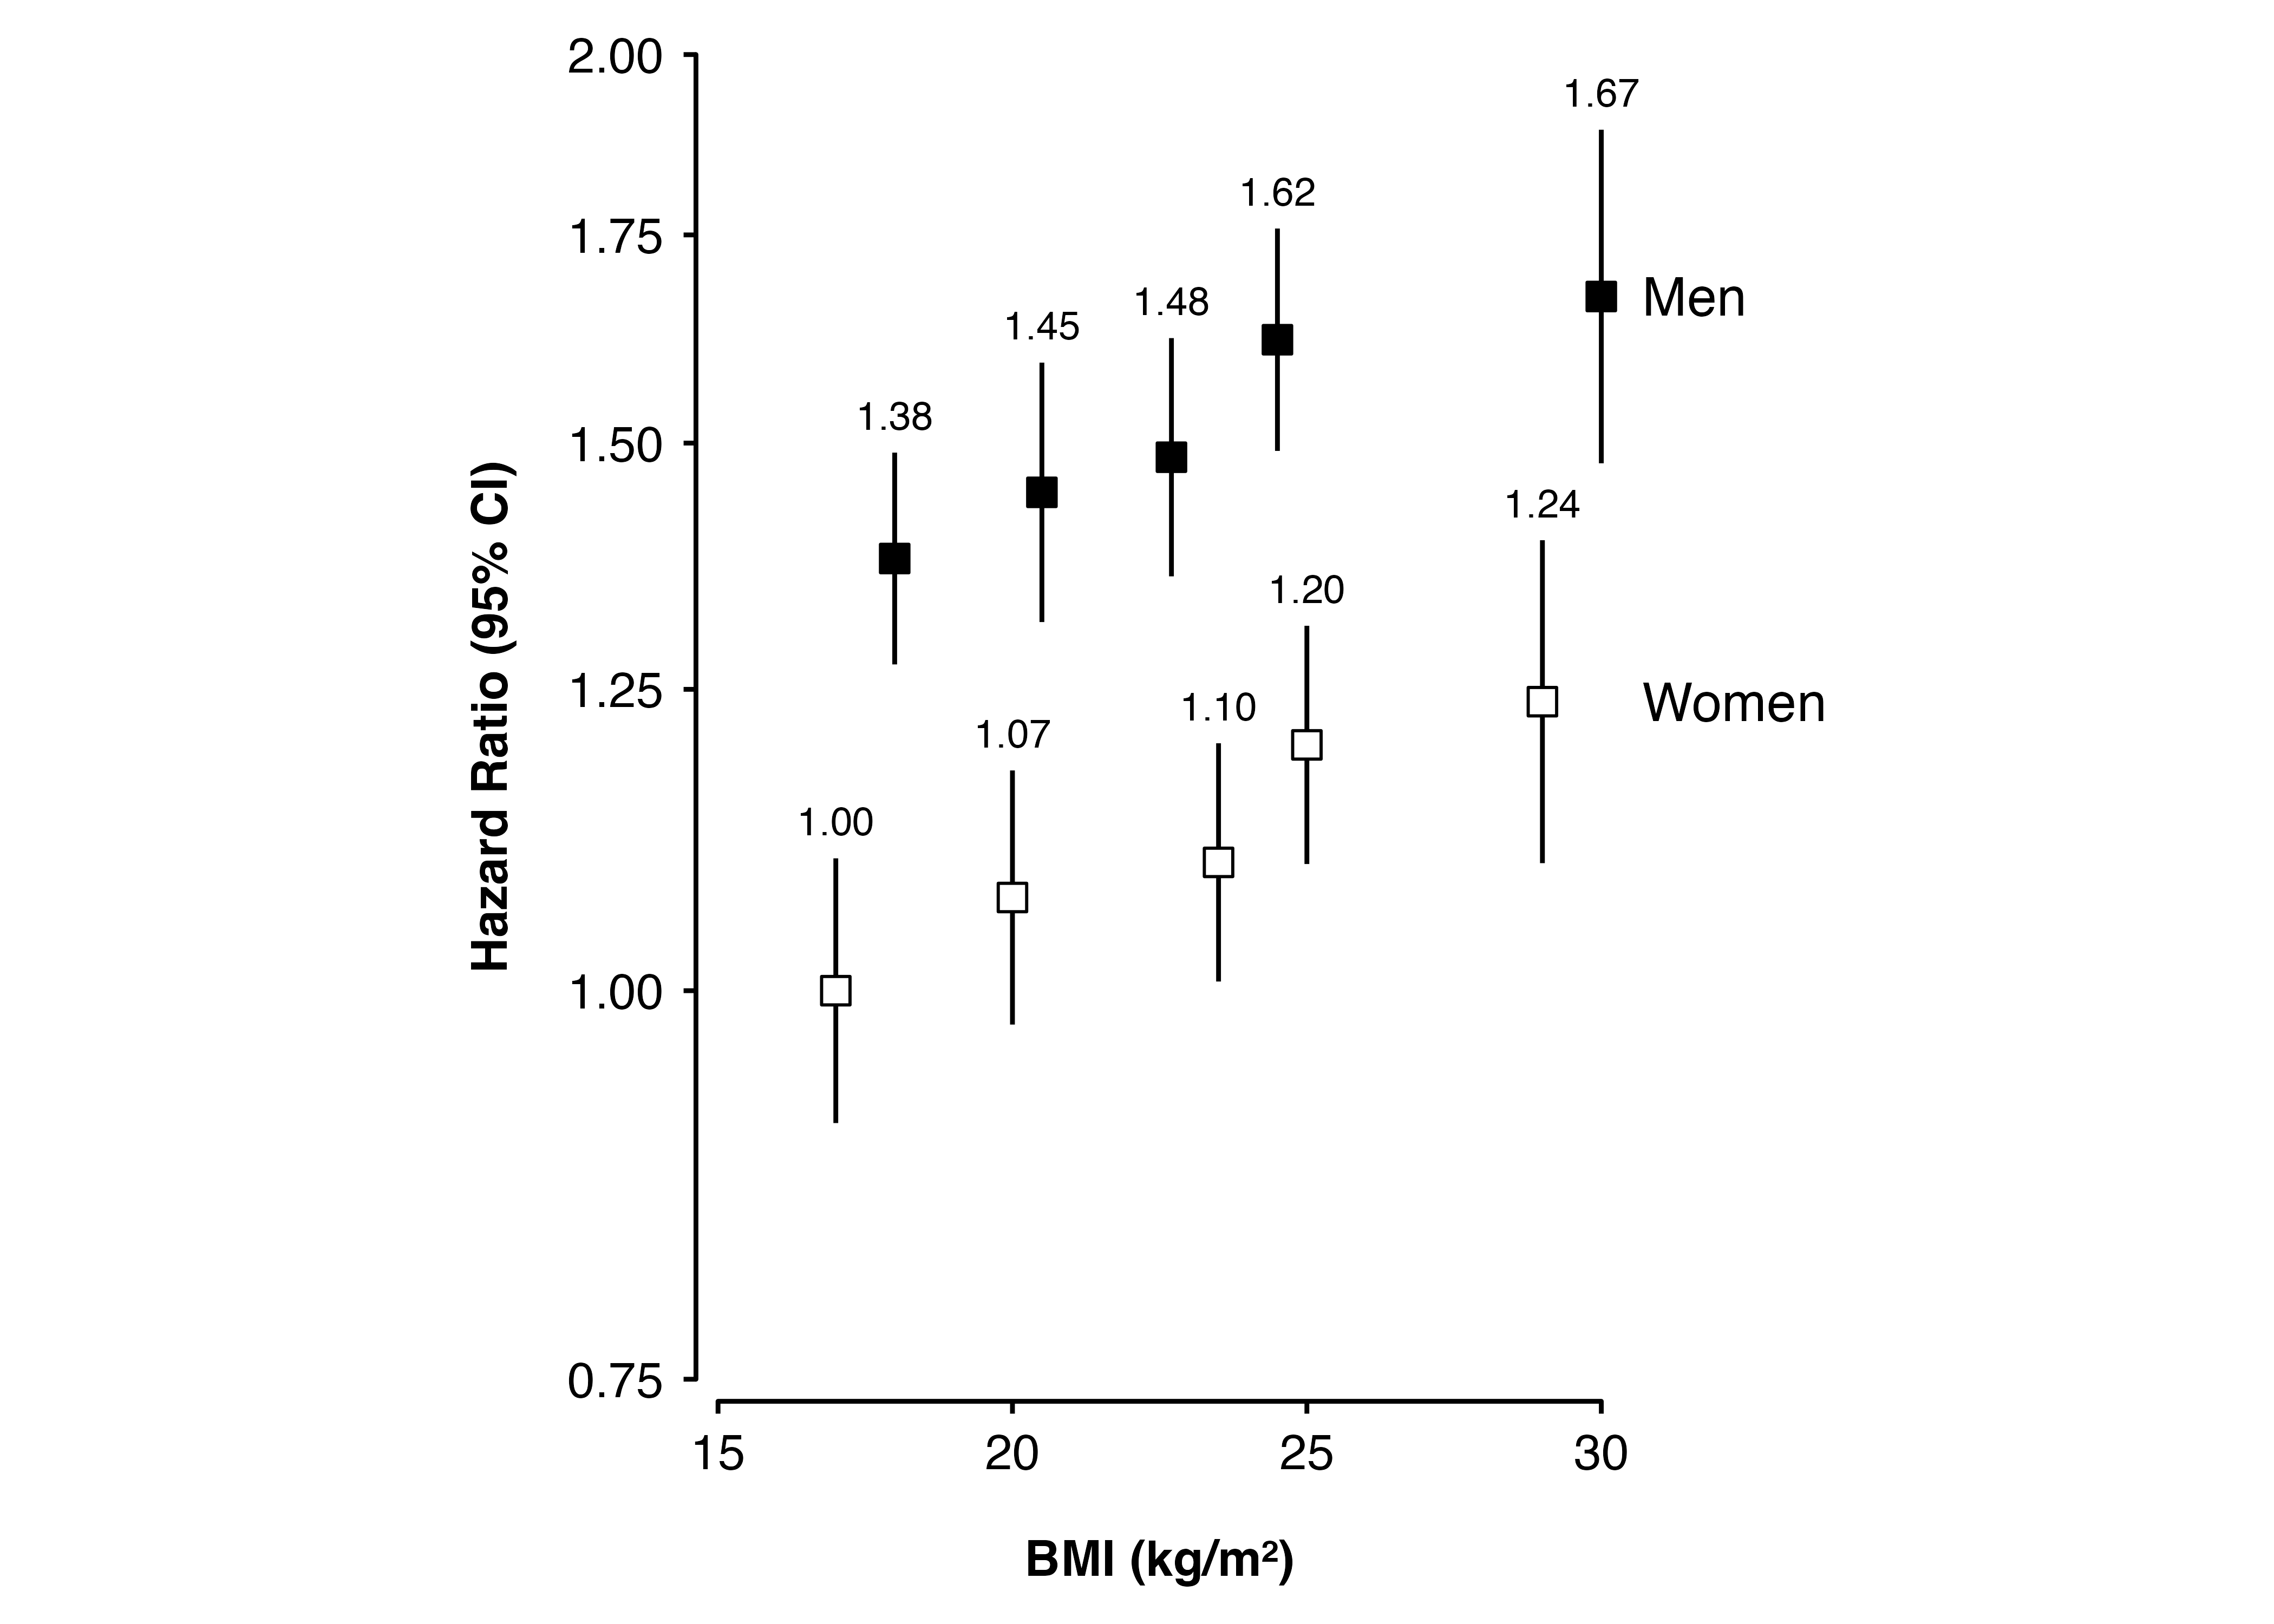
Labels
annotate() can also be used to manually label groups or different analyses.
group_labels <- annotate(geom  = "text",
                         x     = I(1.02),
                         y     = exp(c(0.514, 0.214)),
                         hjust = 0,
                         size  = 4.2,
                         label = c("Men", "Women"))

shape_plot(my_results,
           col.x           = "risk_factor",
           xlims           = c(15, 30),
           ylims           = c(0.75, 2),
           exponentiate    = TRUE,
           xlab            = "BMI (kg/m\u00B2)",
           ylab            = "Hazard Ratio (95% CI)",
           col.group       = "group",
           ciunder         = TRUE,
           legend.position = "none",
           add             = list(end = group_labels),
           plot.margin     = margin(0.5, 3.5, 0.5, 0.5, "lines"))
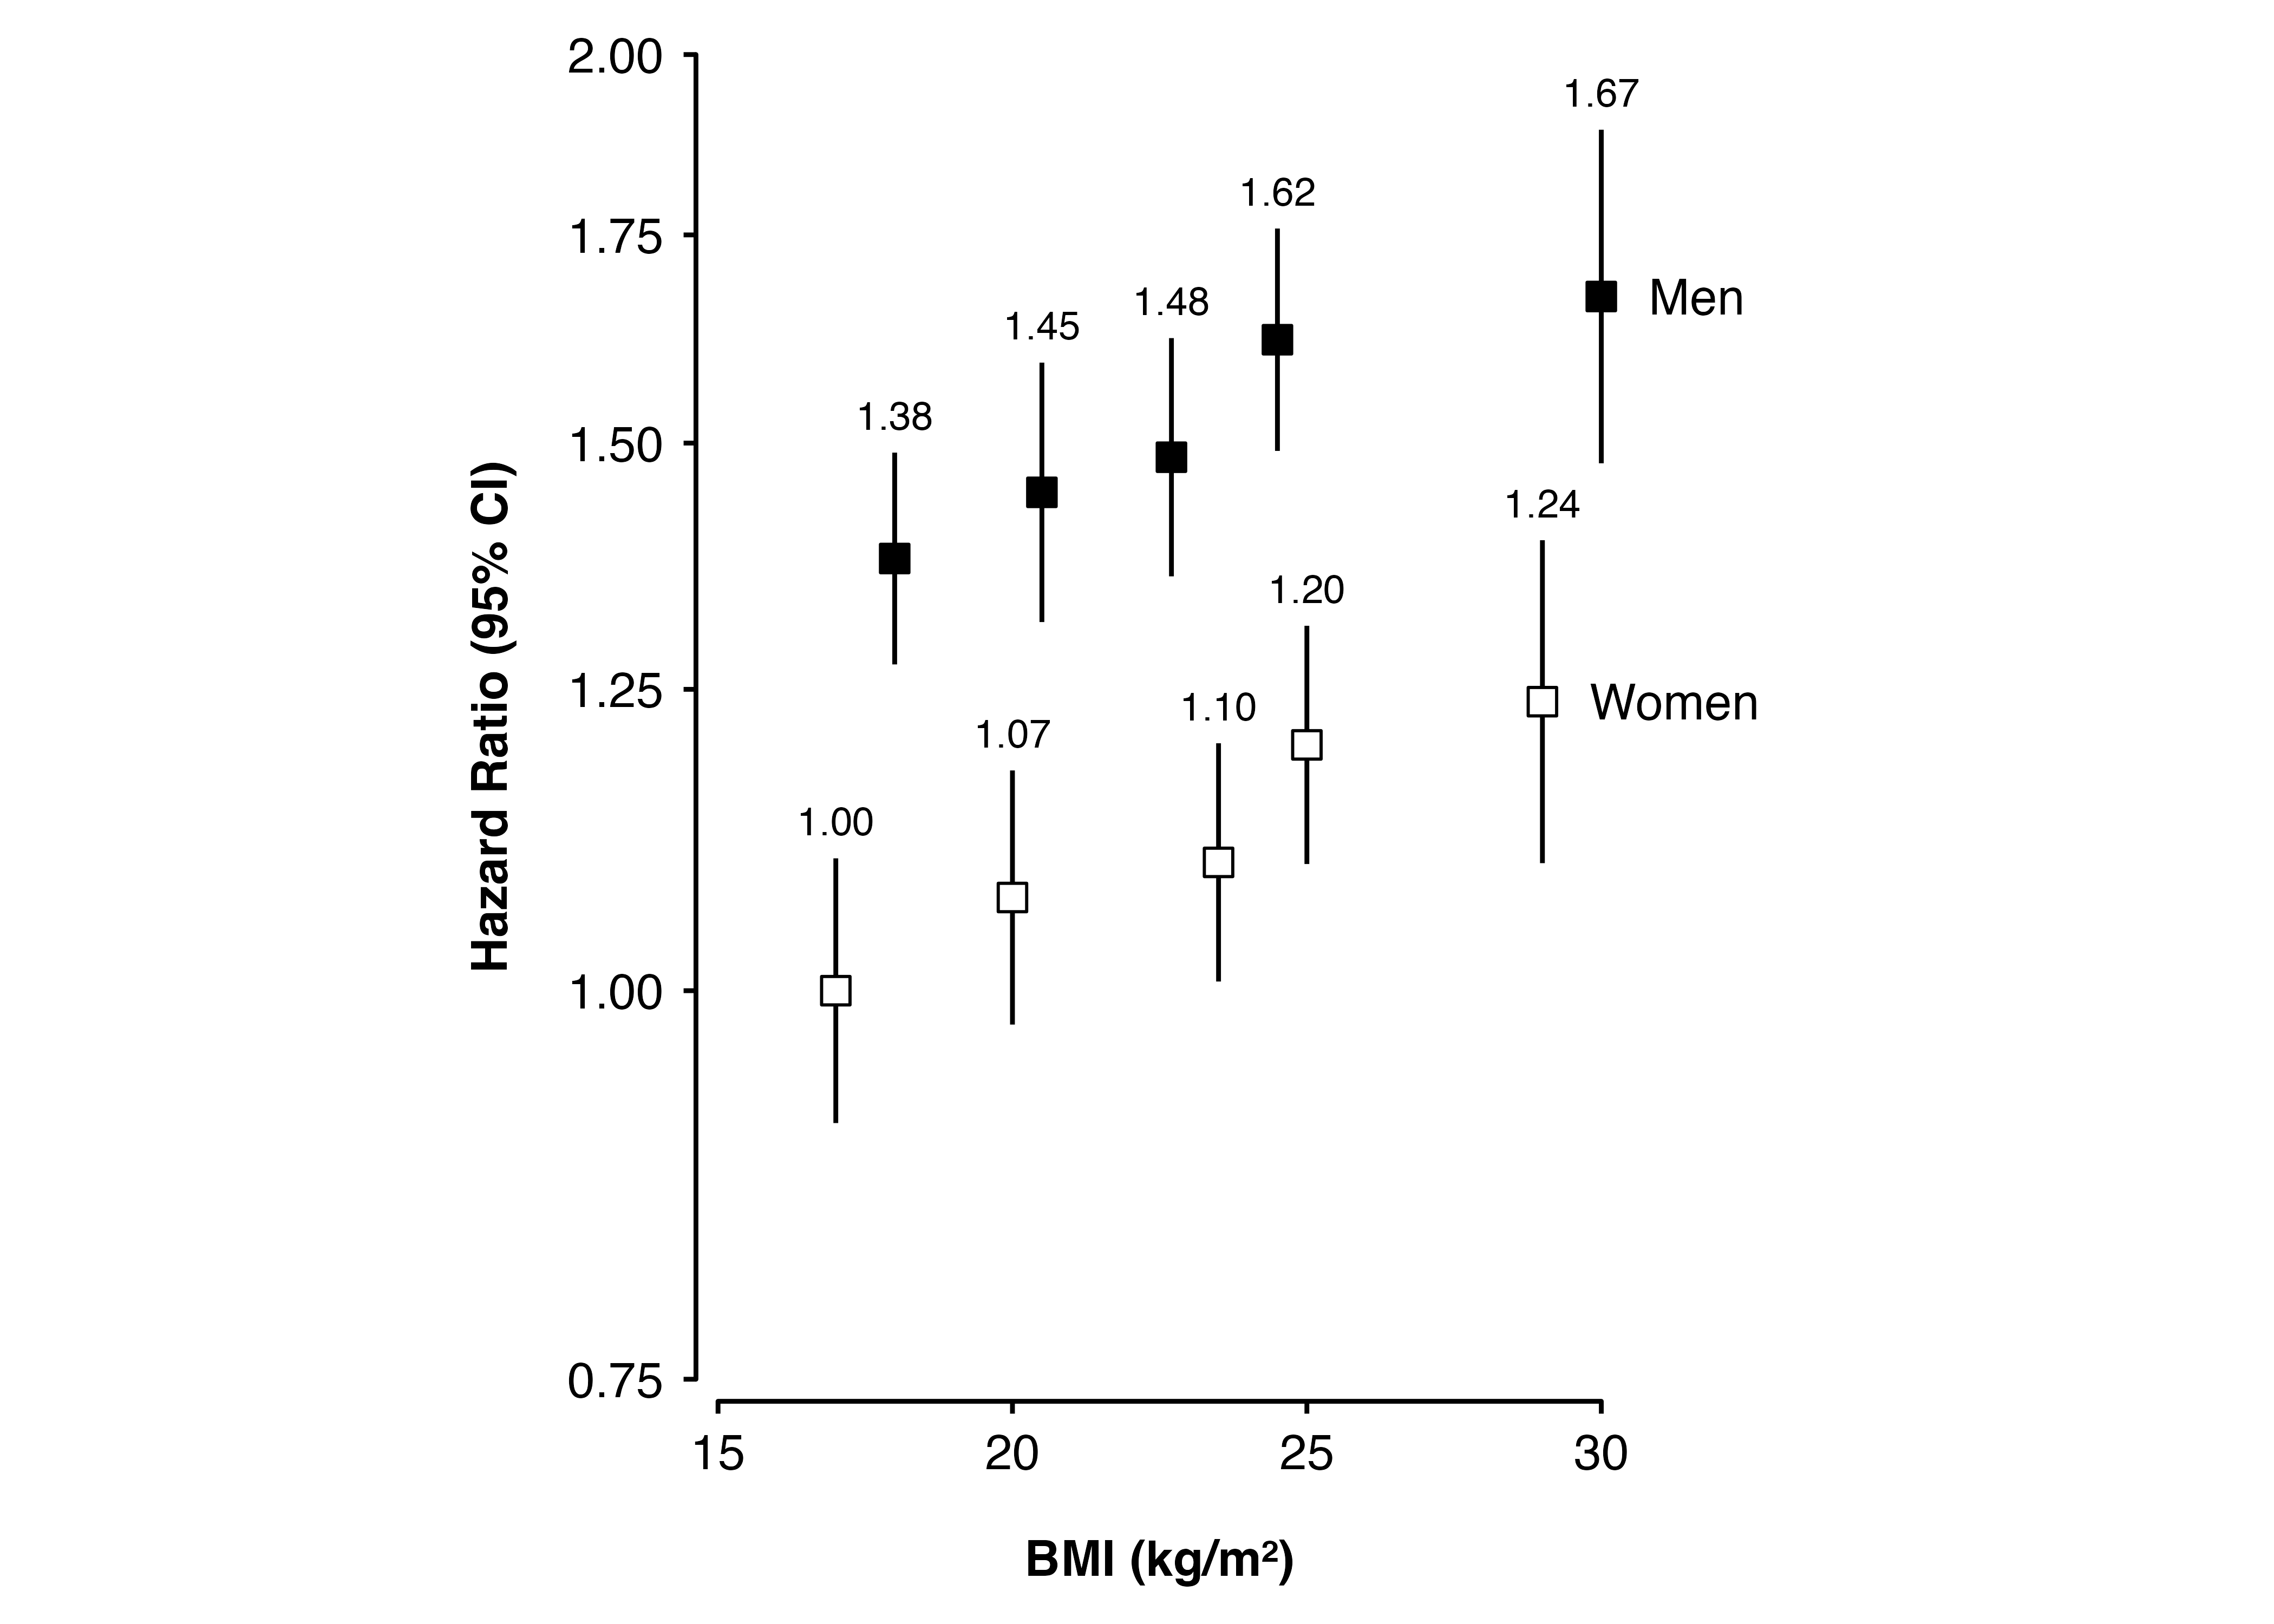
This could also be done using geom_text() and using dplyr::filter() to select one point per group.
group_labels <- geom_text(aes(label = group),
                          hjust = 0,
                          nudge_x = 0.8,
                          data = \(x) dplyr::filter(x, risk_factor > 27))

shape_plot(my_results,
           col.x           = "risk_factor",
           xlims           = c(15, 30),
           ylims           = c(0.75, 2),
           exponentiate    = TRUE,
           xlab            = "BMI (kg/m\u00B2)",
           ylab            = "Hazard Ratio (95% CI)",
           col.group       = "group",
           ciunder         = TRUE,
           legend.position = "none",
           add             = list(end = group_labels),
           plot.margin     = margin(0.5, 3.5, 0.5, 0.5, "lines"))