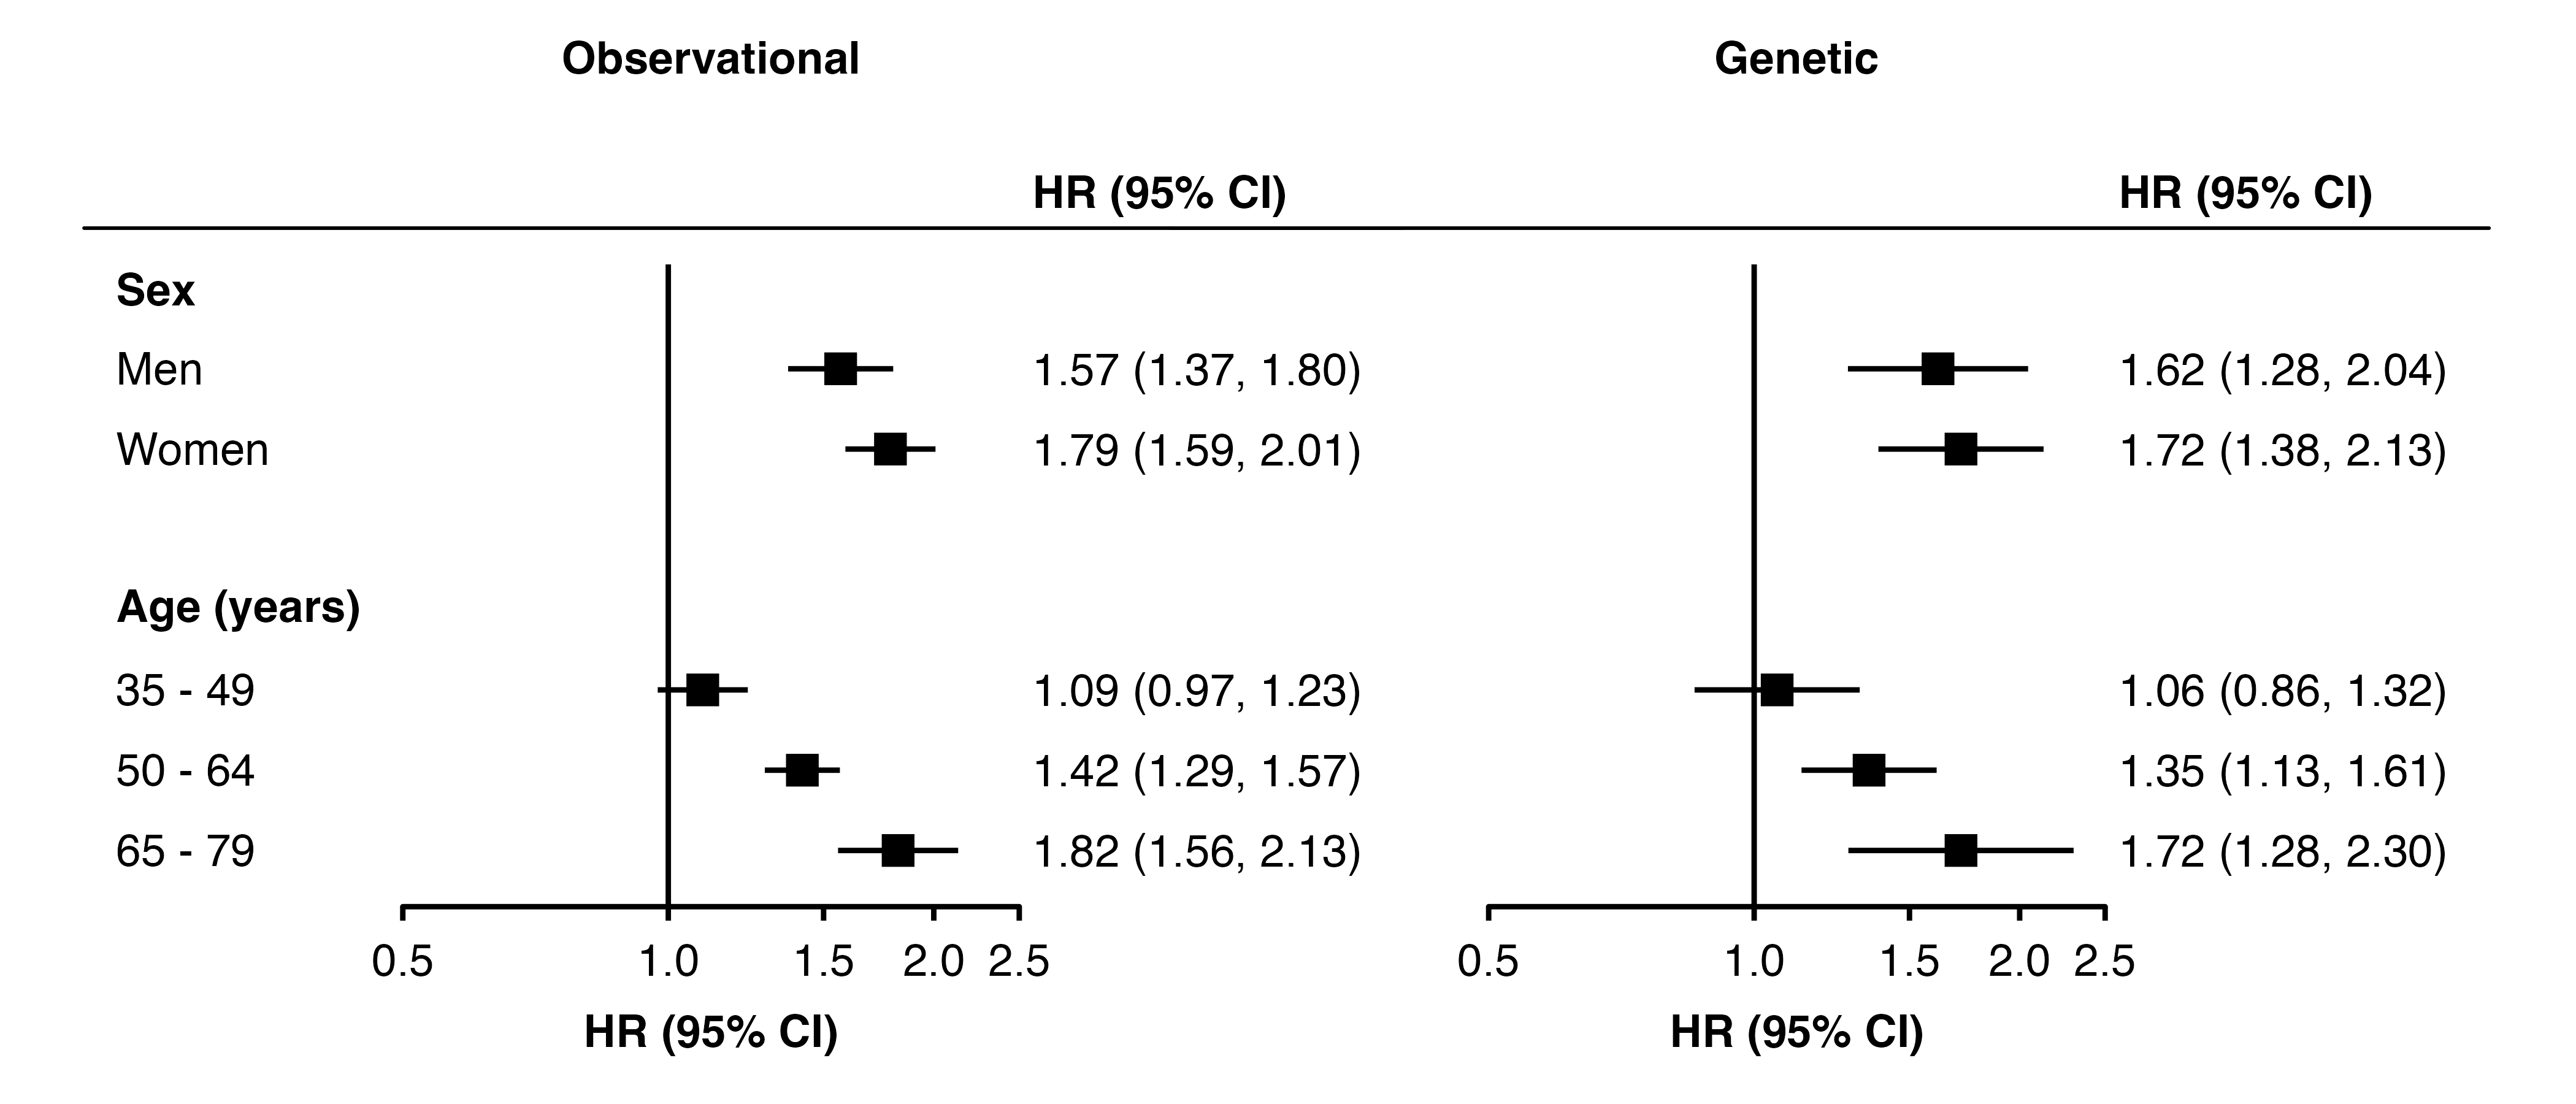
forest_plot(list("Observational" = my_resultsA,
                 "Genetic"       = my_resultsB),
            col.key    = "subgroup",
            row.labels = row_labels,
            heading.rule = TRUE)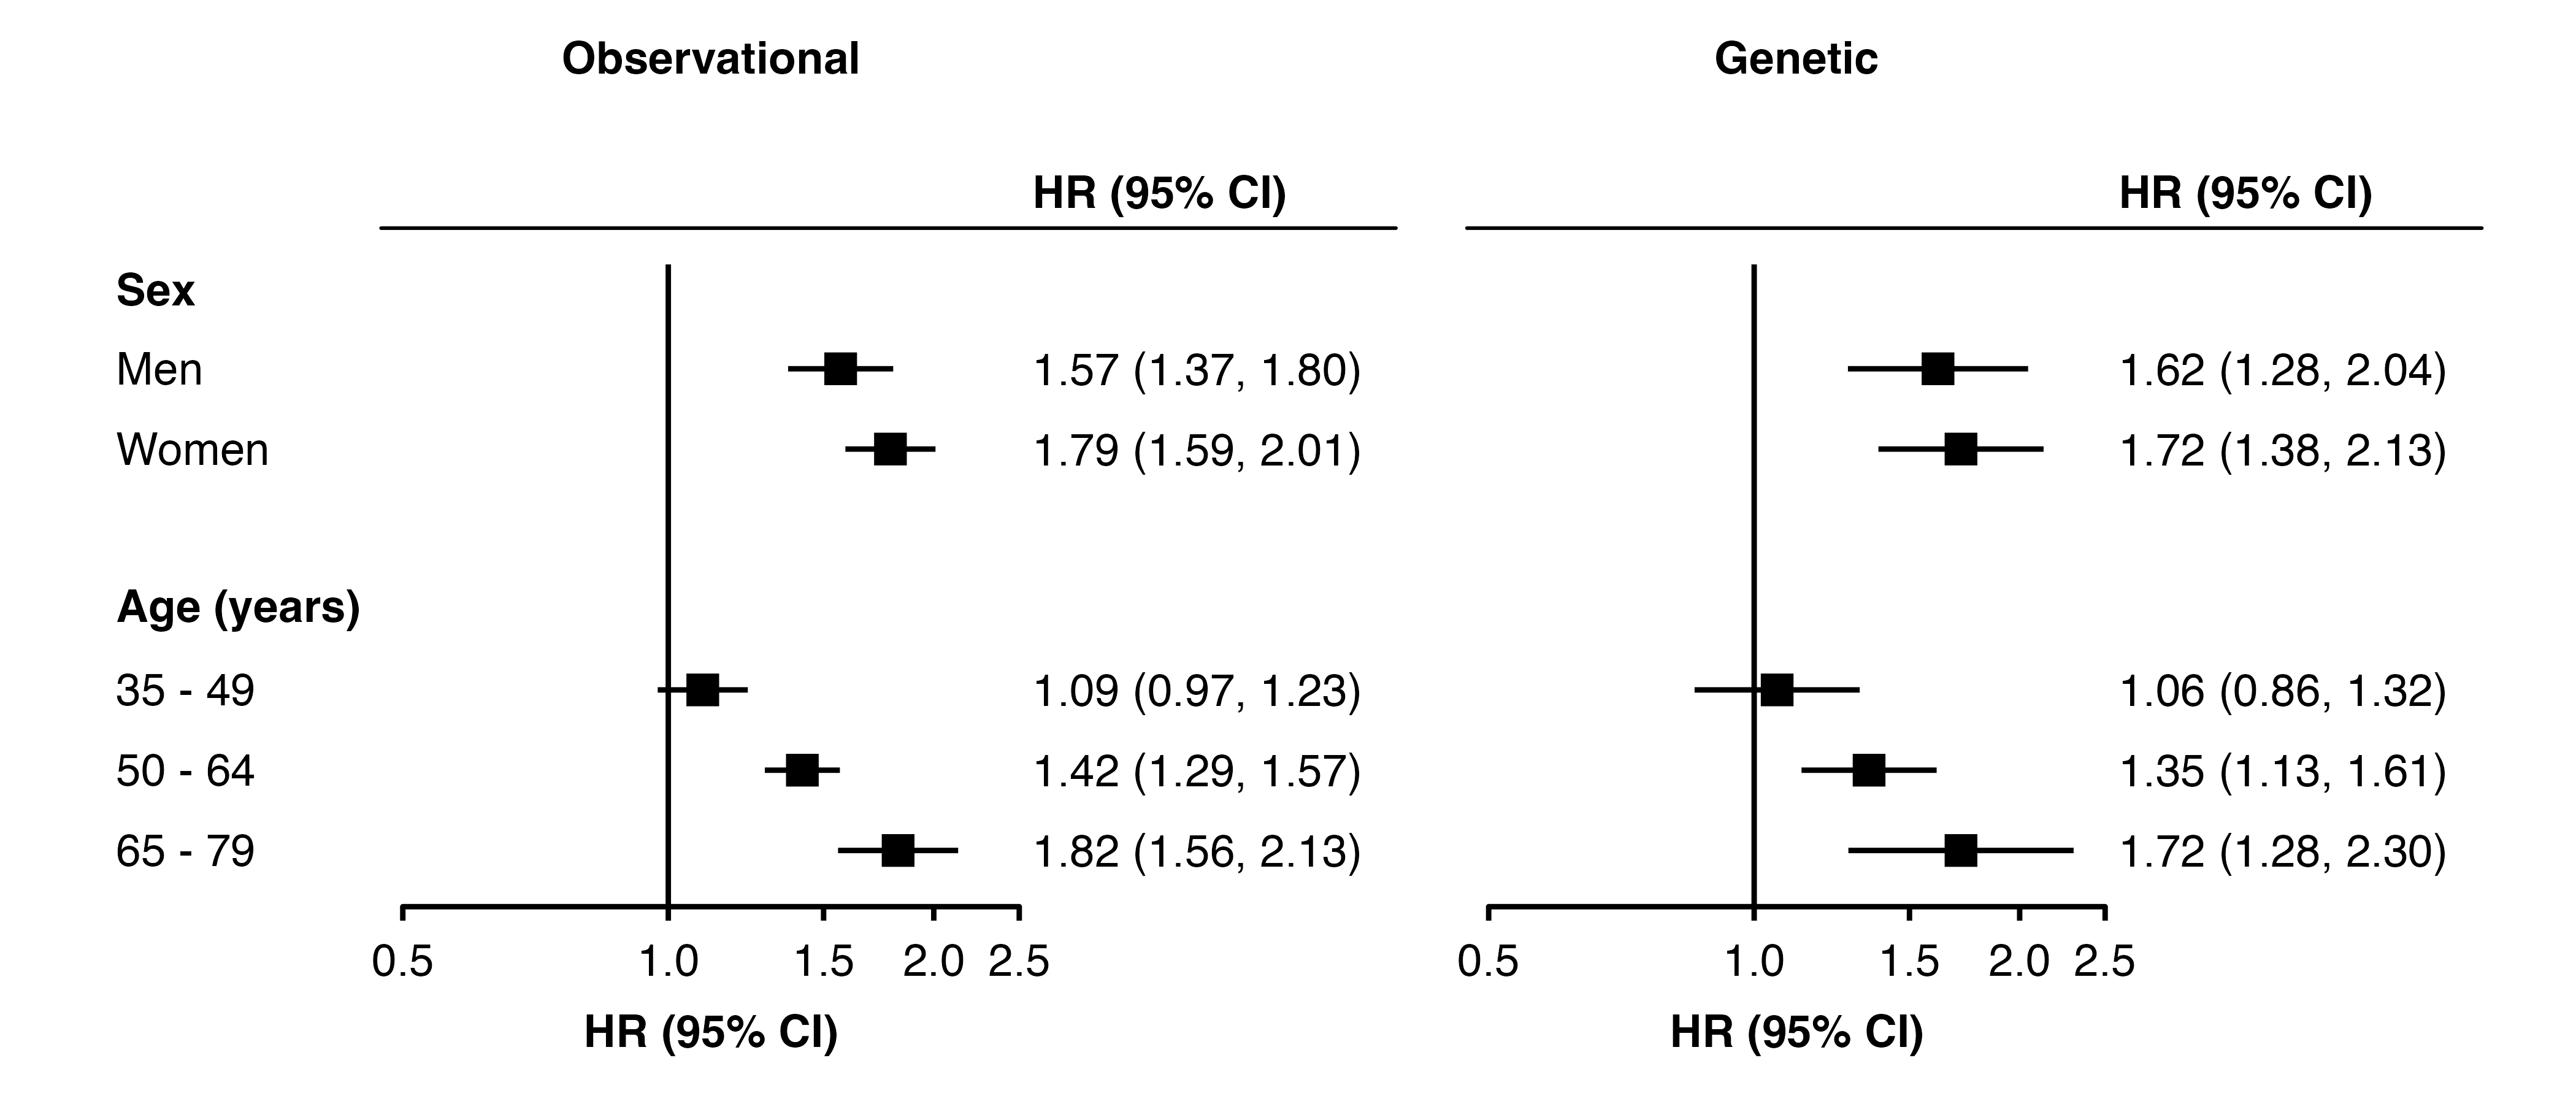
In forest_plot(), set heading.rule = TRUE to add a horizontal rule below the column headings for each panel. By default, it will extend to the width of the columns either side of each panel.
forest_plot(list("Observational" = my_resultsA,
"Genetic" = my_resultsB),
col.key = "subgroup",
row.labels = row_labels,
heading.rule = TRUE)
Use unit() to set how far each rule should extended beyond the plotting area.
forest_plot(list("Observational" = my_resultsA,
                 "Genetic"       = my_resultsB),
            col.key    = "subgroup",
            row.labels = row_labels,
            heading.rule = unit(5, "mm"))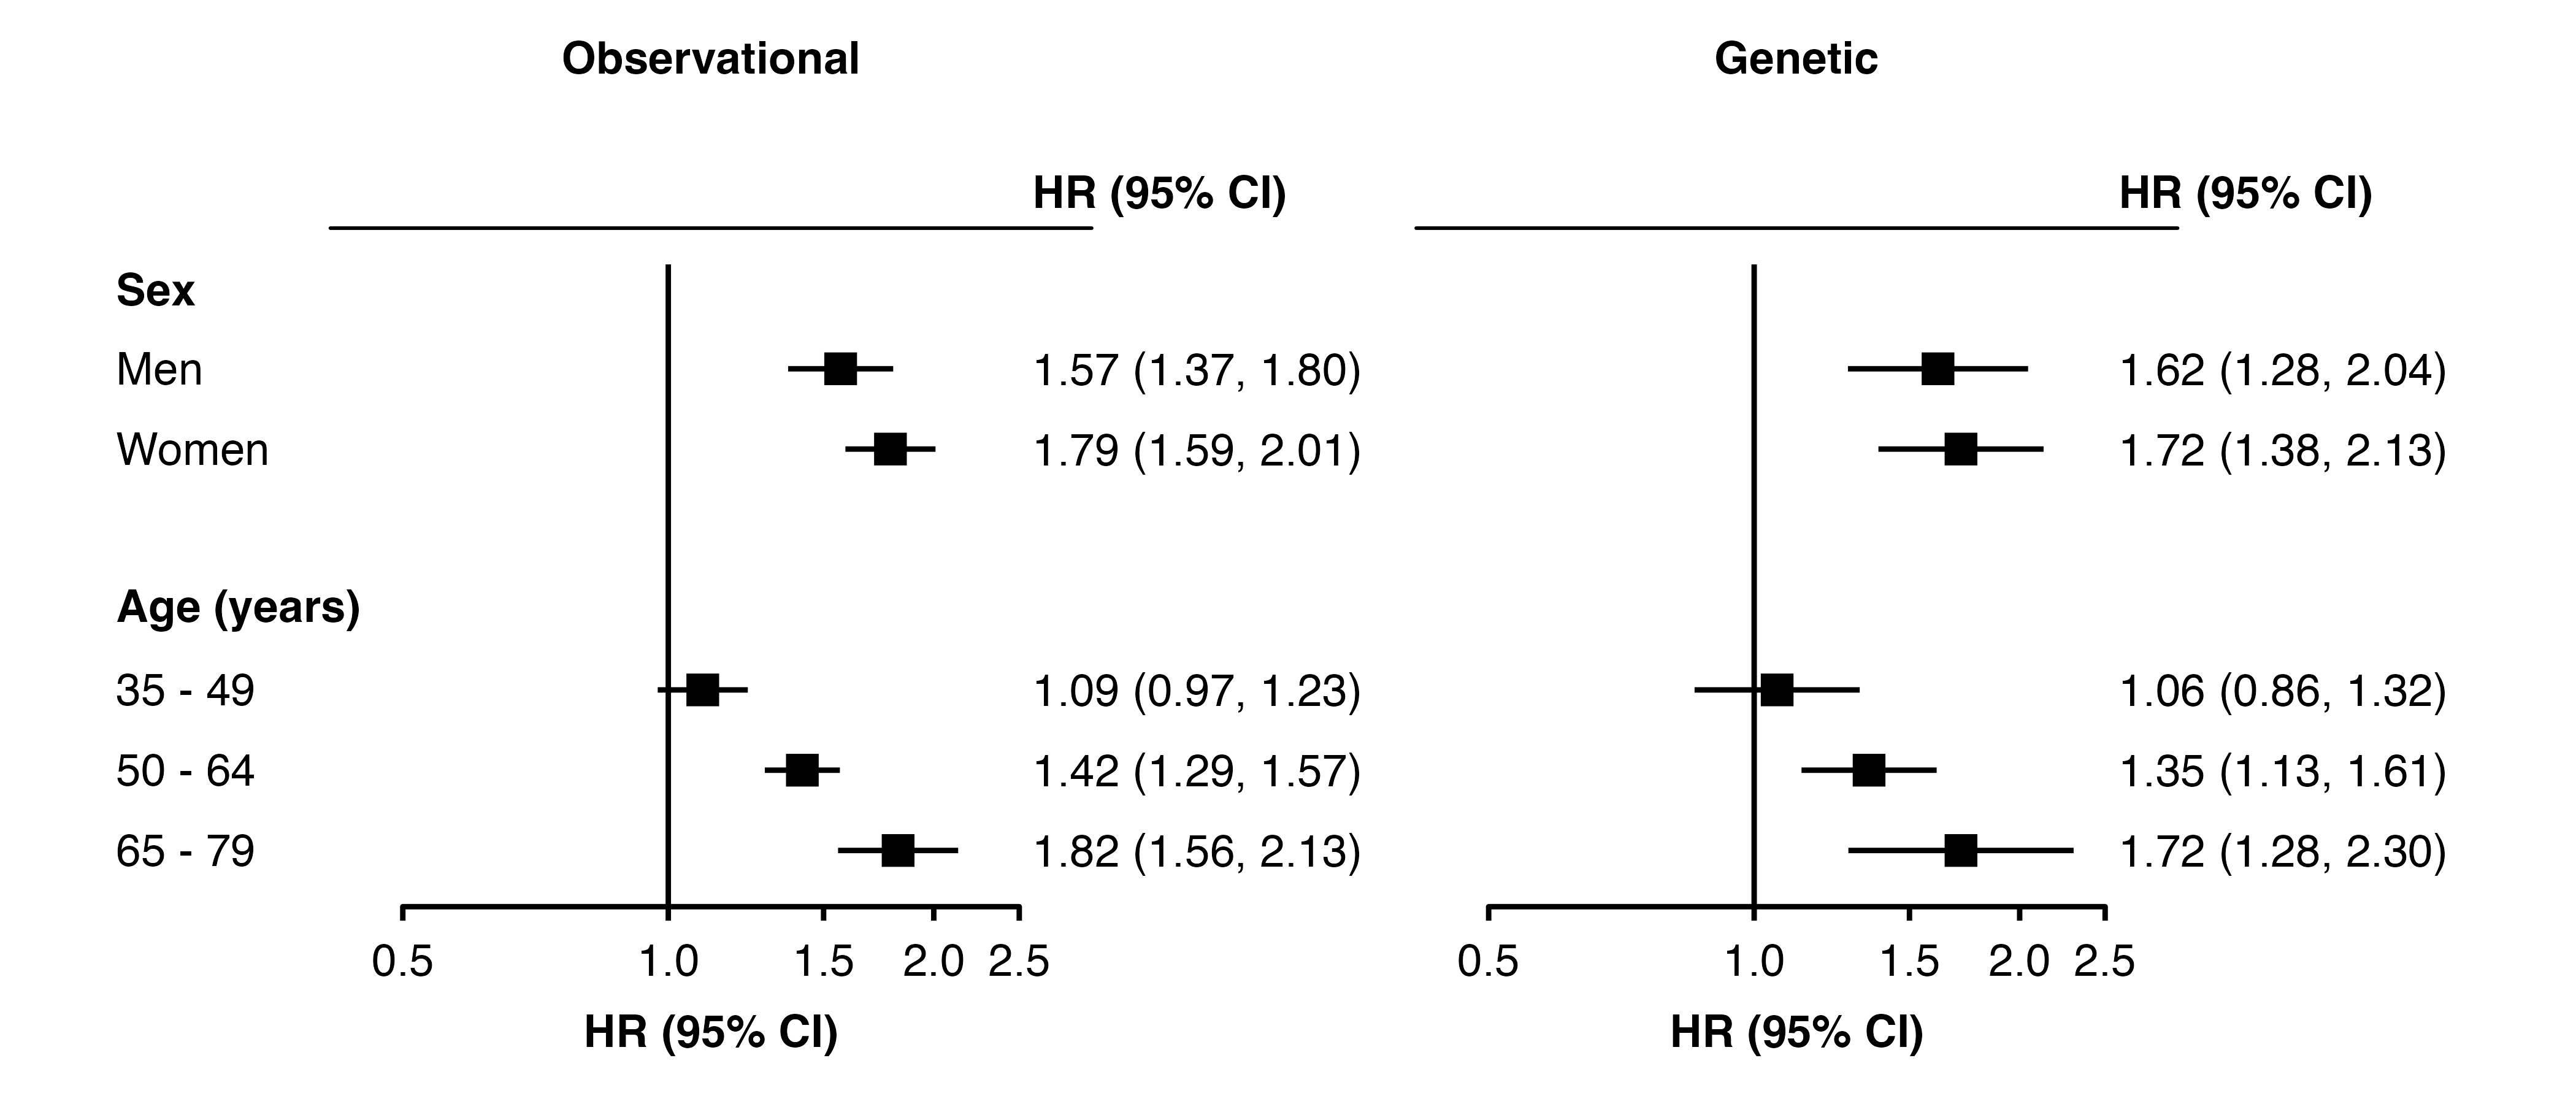
Use a unit() of length 2 to set the left and right extensions. They will be the same for all panels. By increasing the extension to the left, the appearance of a single rule across the row labels and all panels can be created.
forest_plot(list("Observational" = my_resultsA,
                 "Genetic"       = my_resultsB),
            col.key    = "subgroup",
            row.labels = row_labels,
            heading.rule = unit(c(22, 26.5), "mm"))