4  Add a reference line

The example below shows how to add a reference line to a shape_plot() plot, using add to add a line segment create with annotate().

ref_line <- annotate(geom       = "segment",
                      y         = 1,
                      yend      = 1,
                      x         = 15,
                      xend      = 30,
                      linewidth = 0.5,
                      linetype  = "dashed",
                      colour    = "grey50")

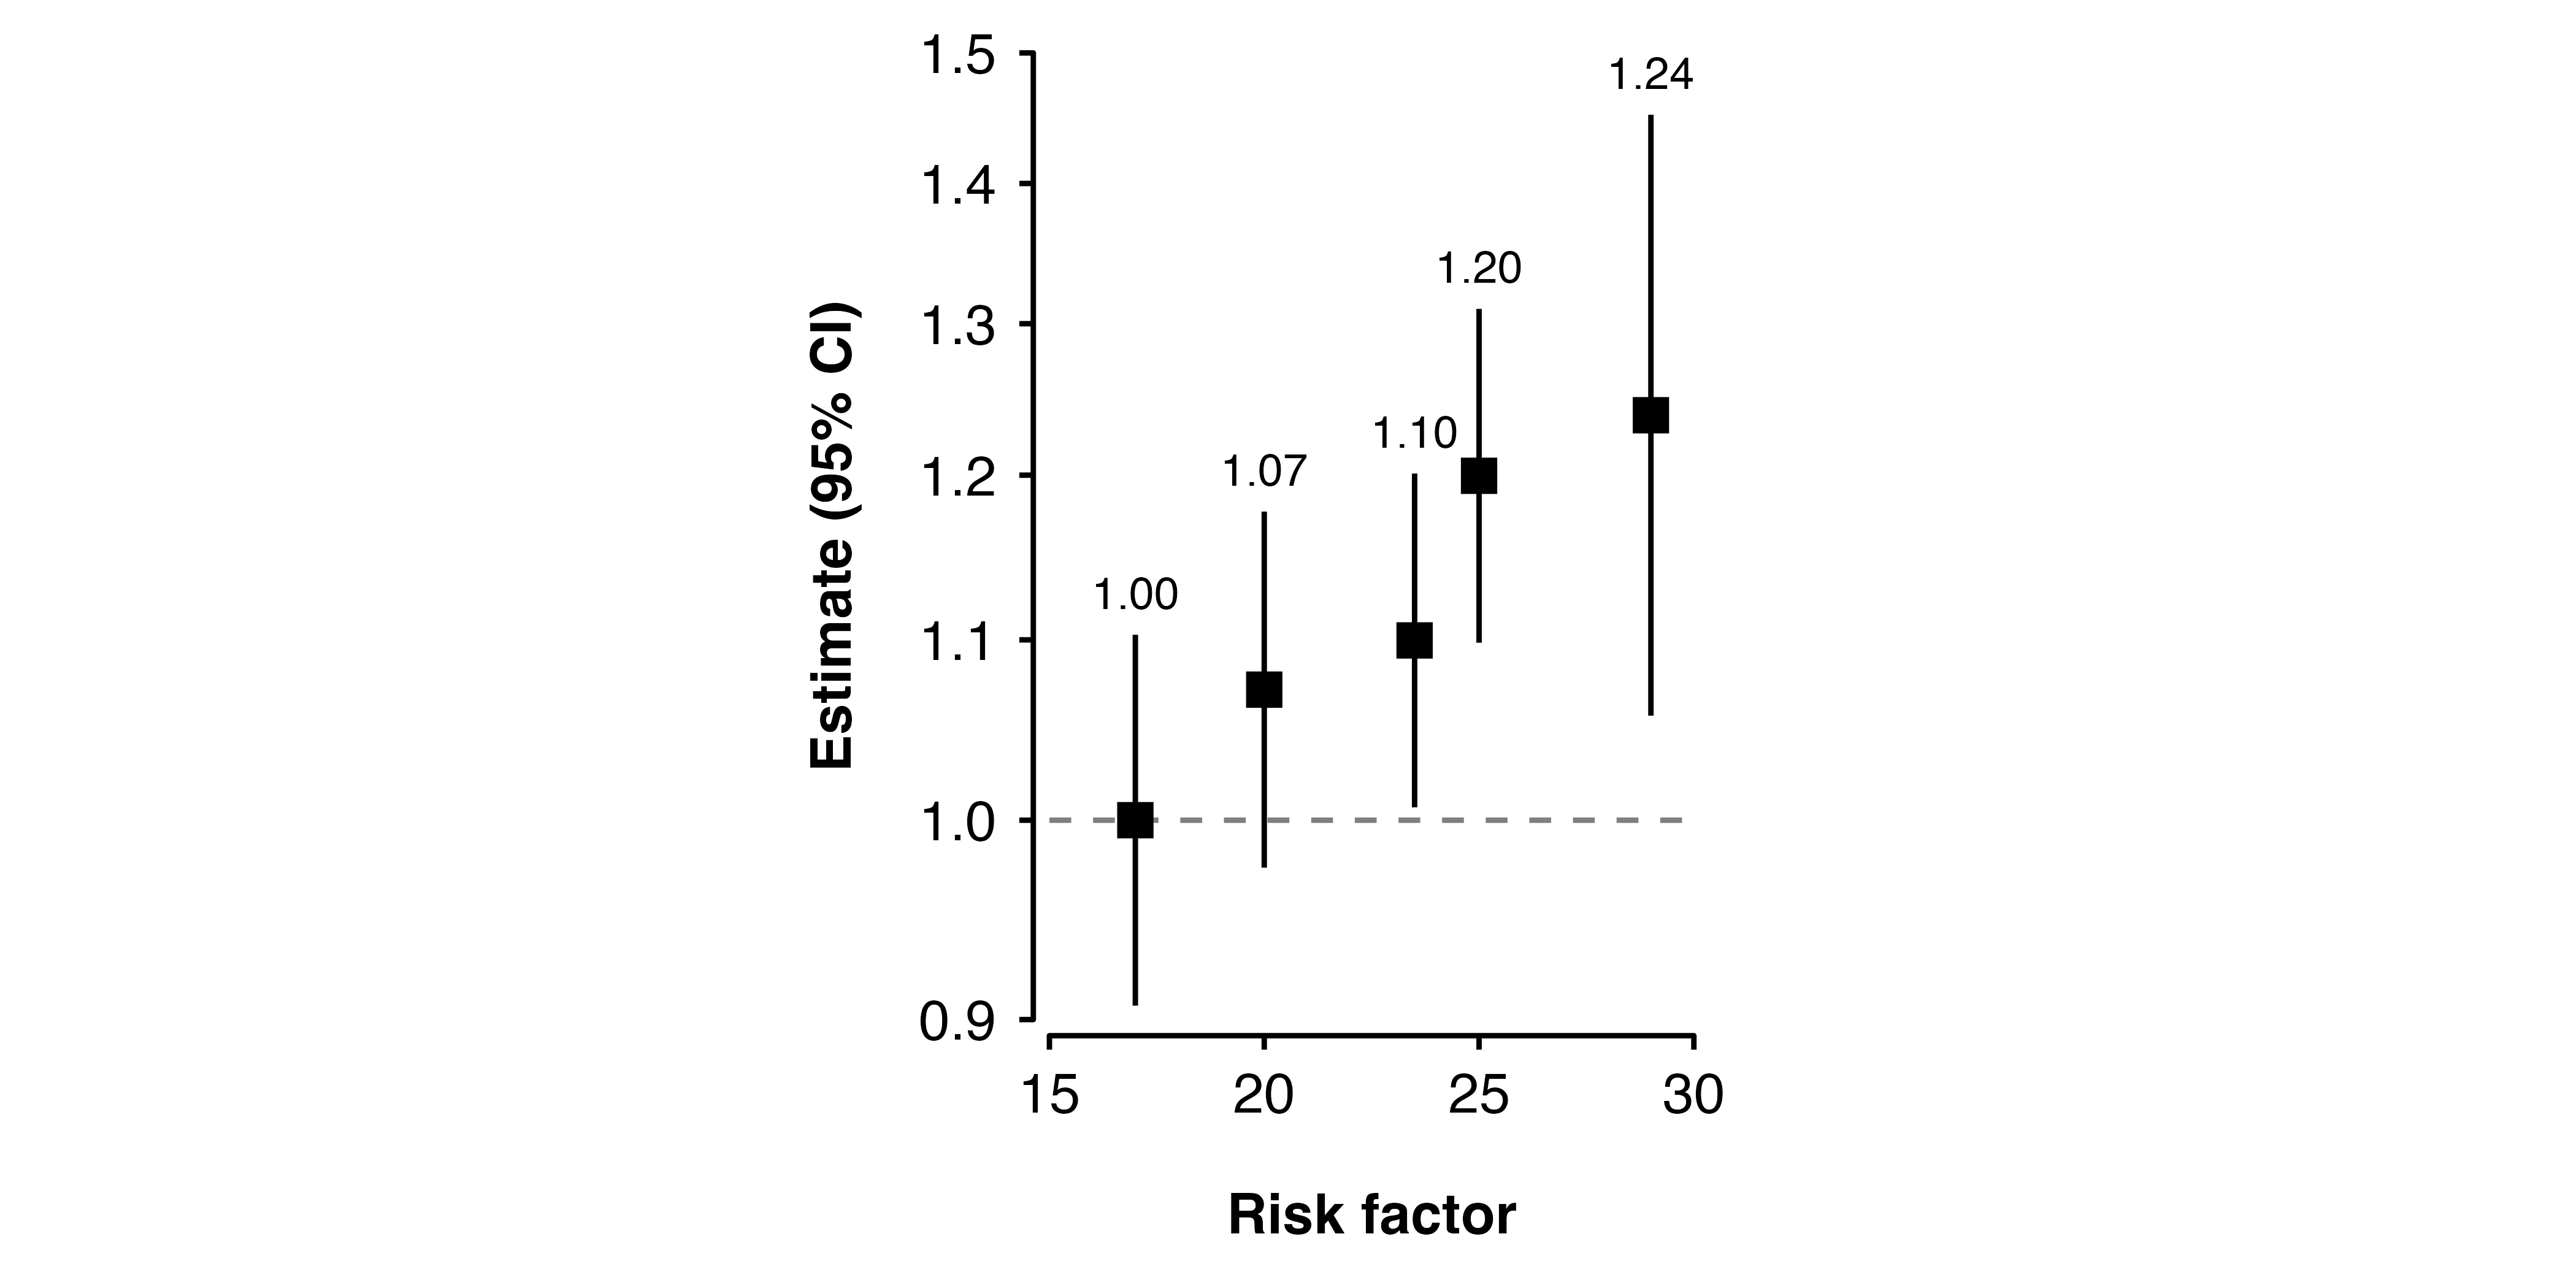
shape_plot(my_results,
           col.x = "risk_factor",
           exponentiate = TRUE,
           xlim = c(15, 30),
           add = list(start = ref_line))