In the forest_plot() function the col.left and col.right arguments can be used to add columns of text to the plot - and they will add these columns for each panel in the plot.
But what if we want to add a column to only the left or right of all panels?
To do this, set text we do not want plotted as missing and adjust the mid.space argument to remove unwanted extra space. For example…
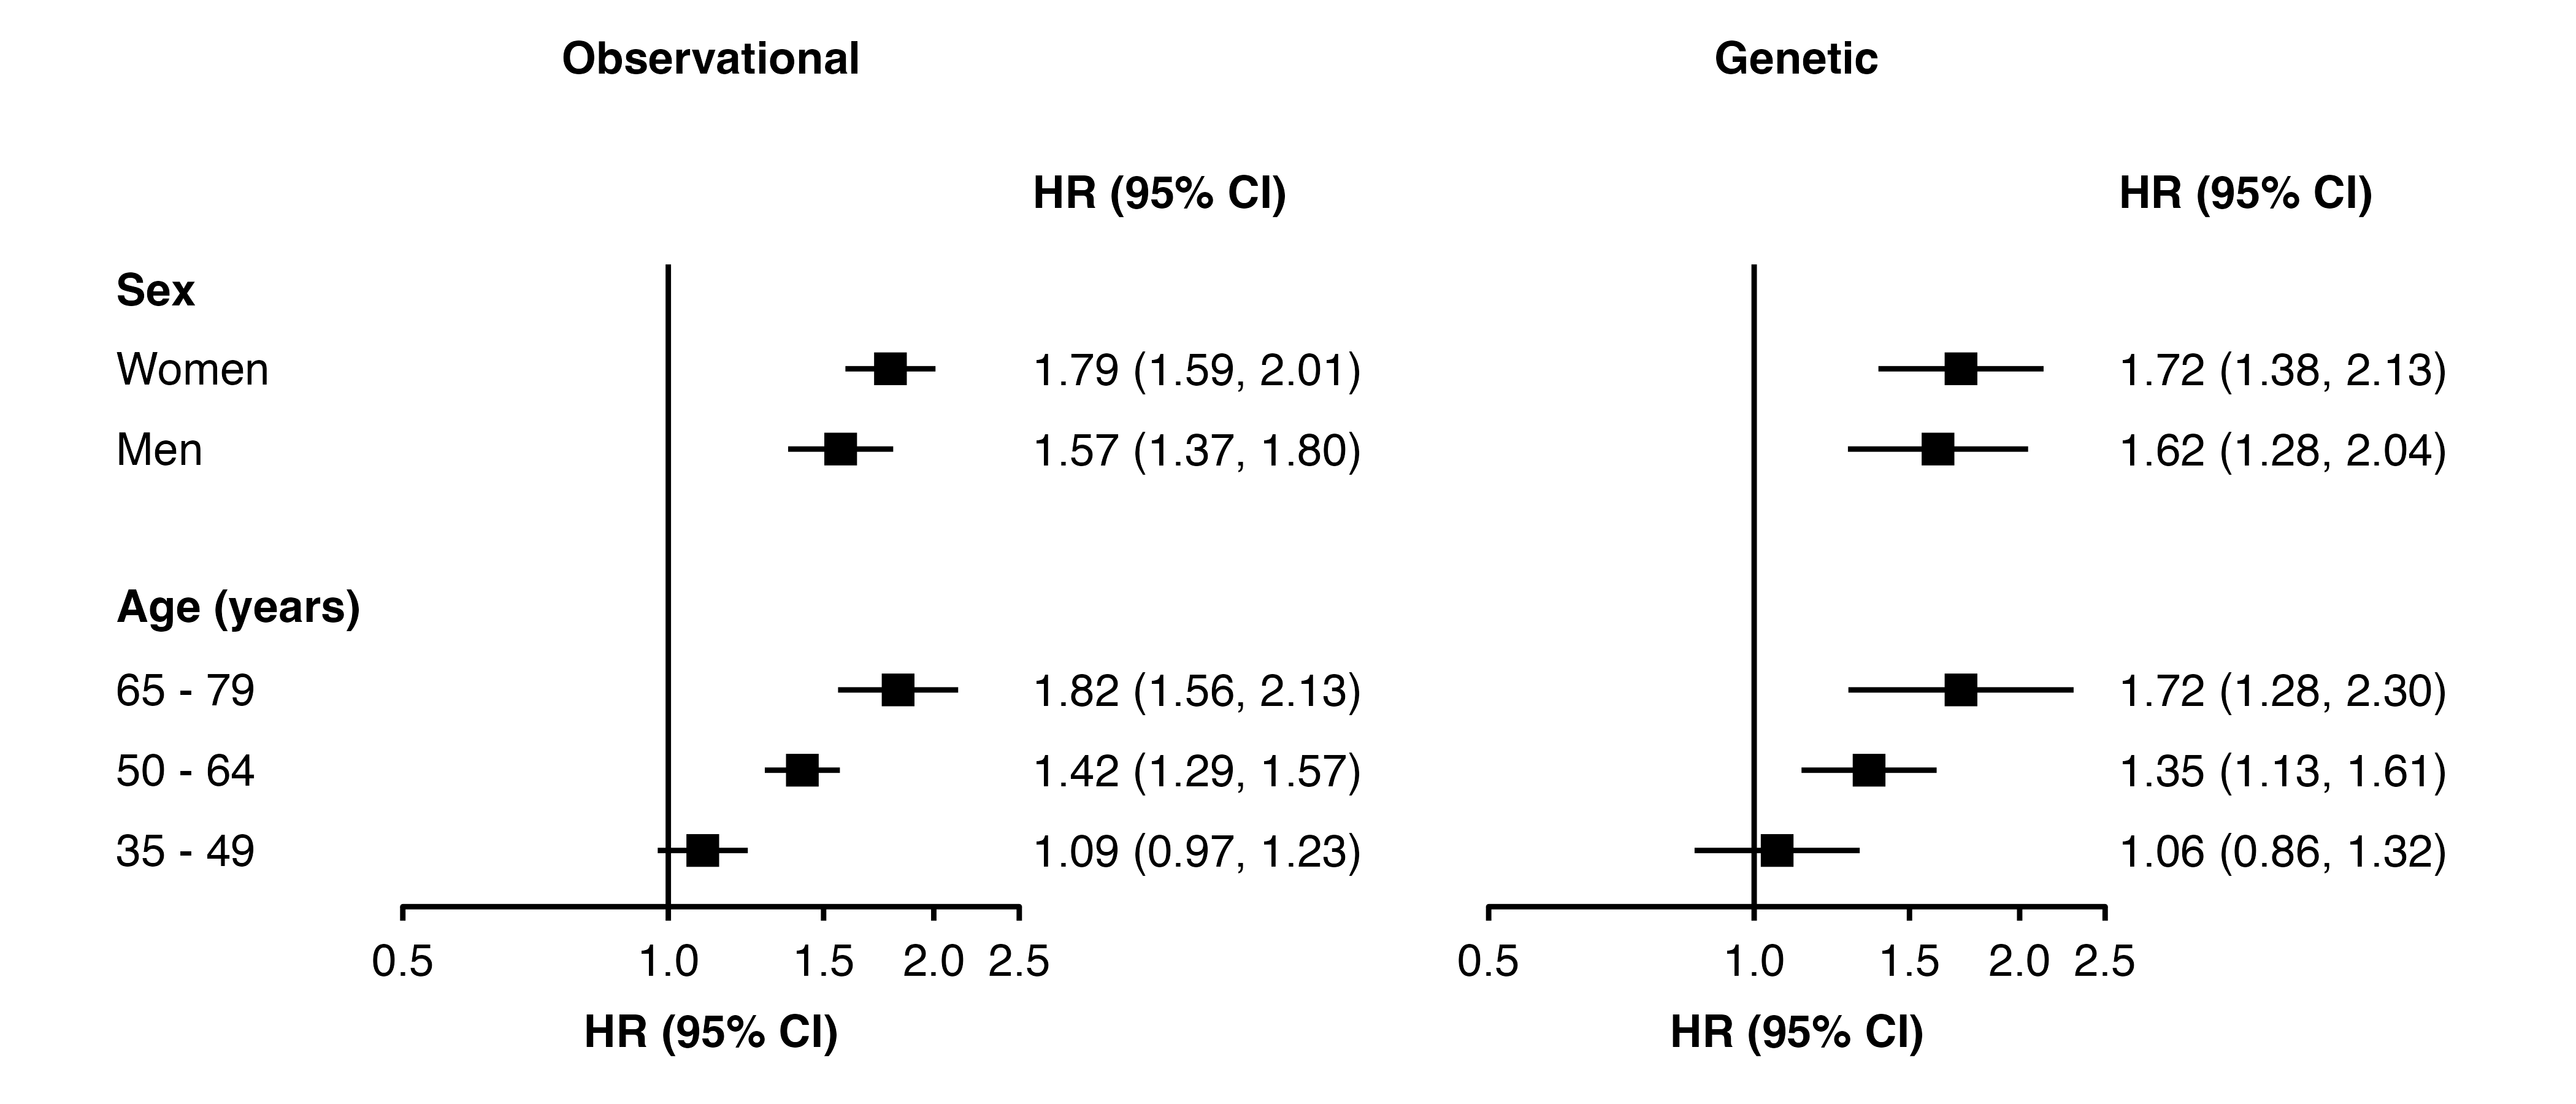
First create a plot without the additional column:
Note the automatically calculated value for left.space is unit(2.9, "mm"), and for right.space is unit(24.5, "mm"). (These are shown in the RStudio Viewer pane.)
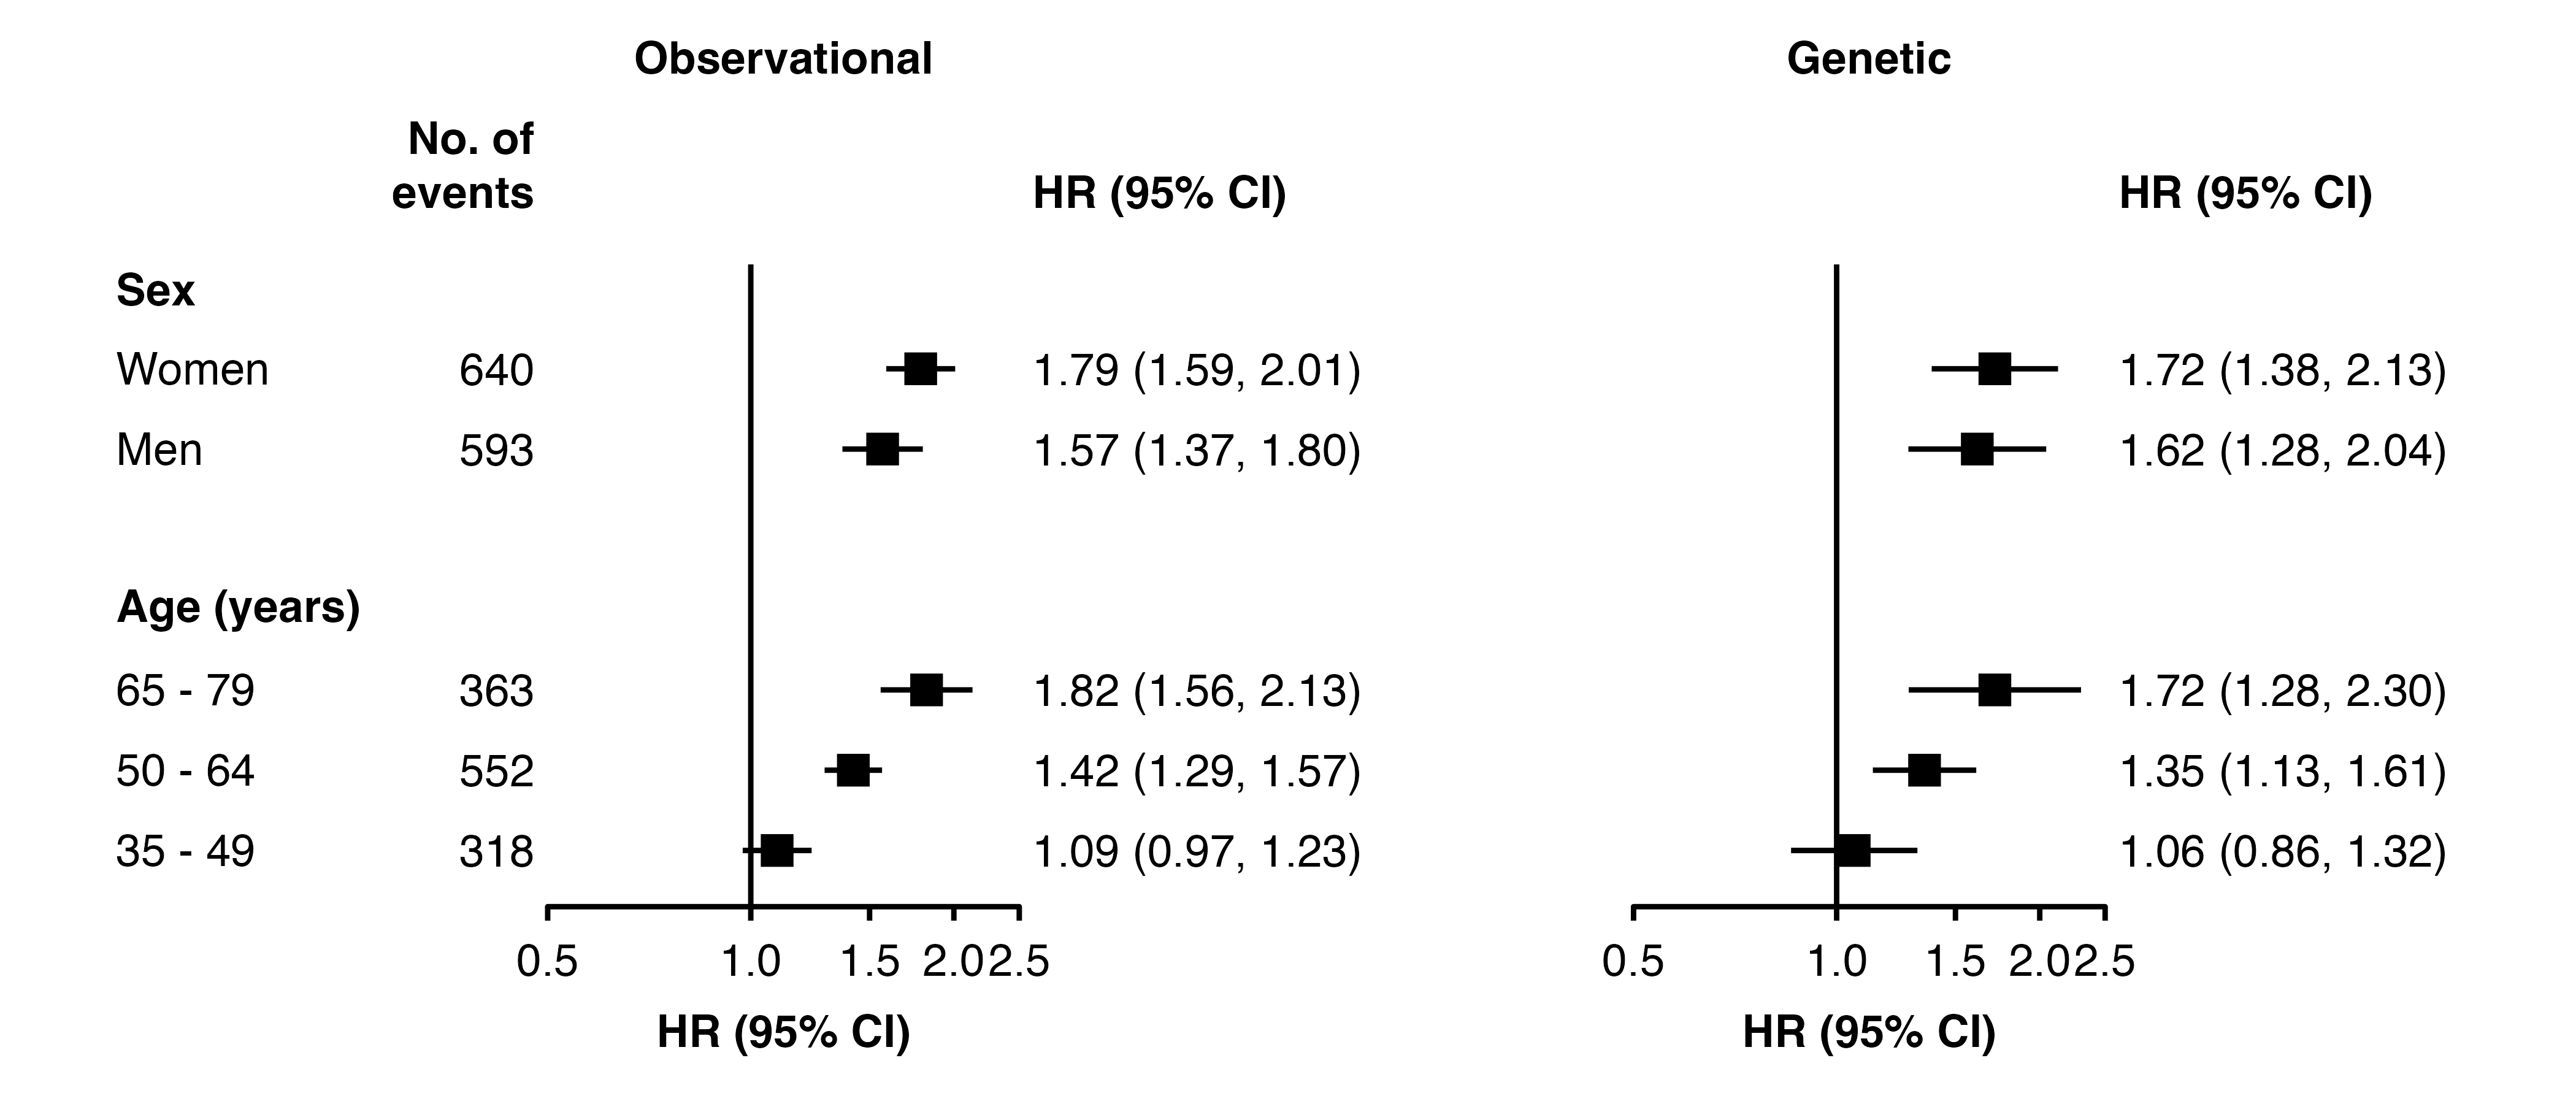
Now create the plot with the additional column n using col.left (or col.right as applicable). To remove the column for the second panel, set the text to be plotted as missing and use a list for left.heading so that the heading is blank for the second panel.
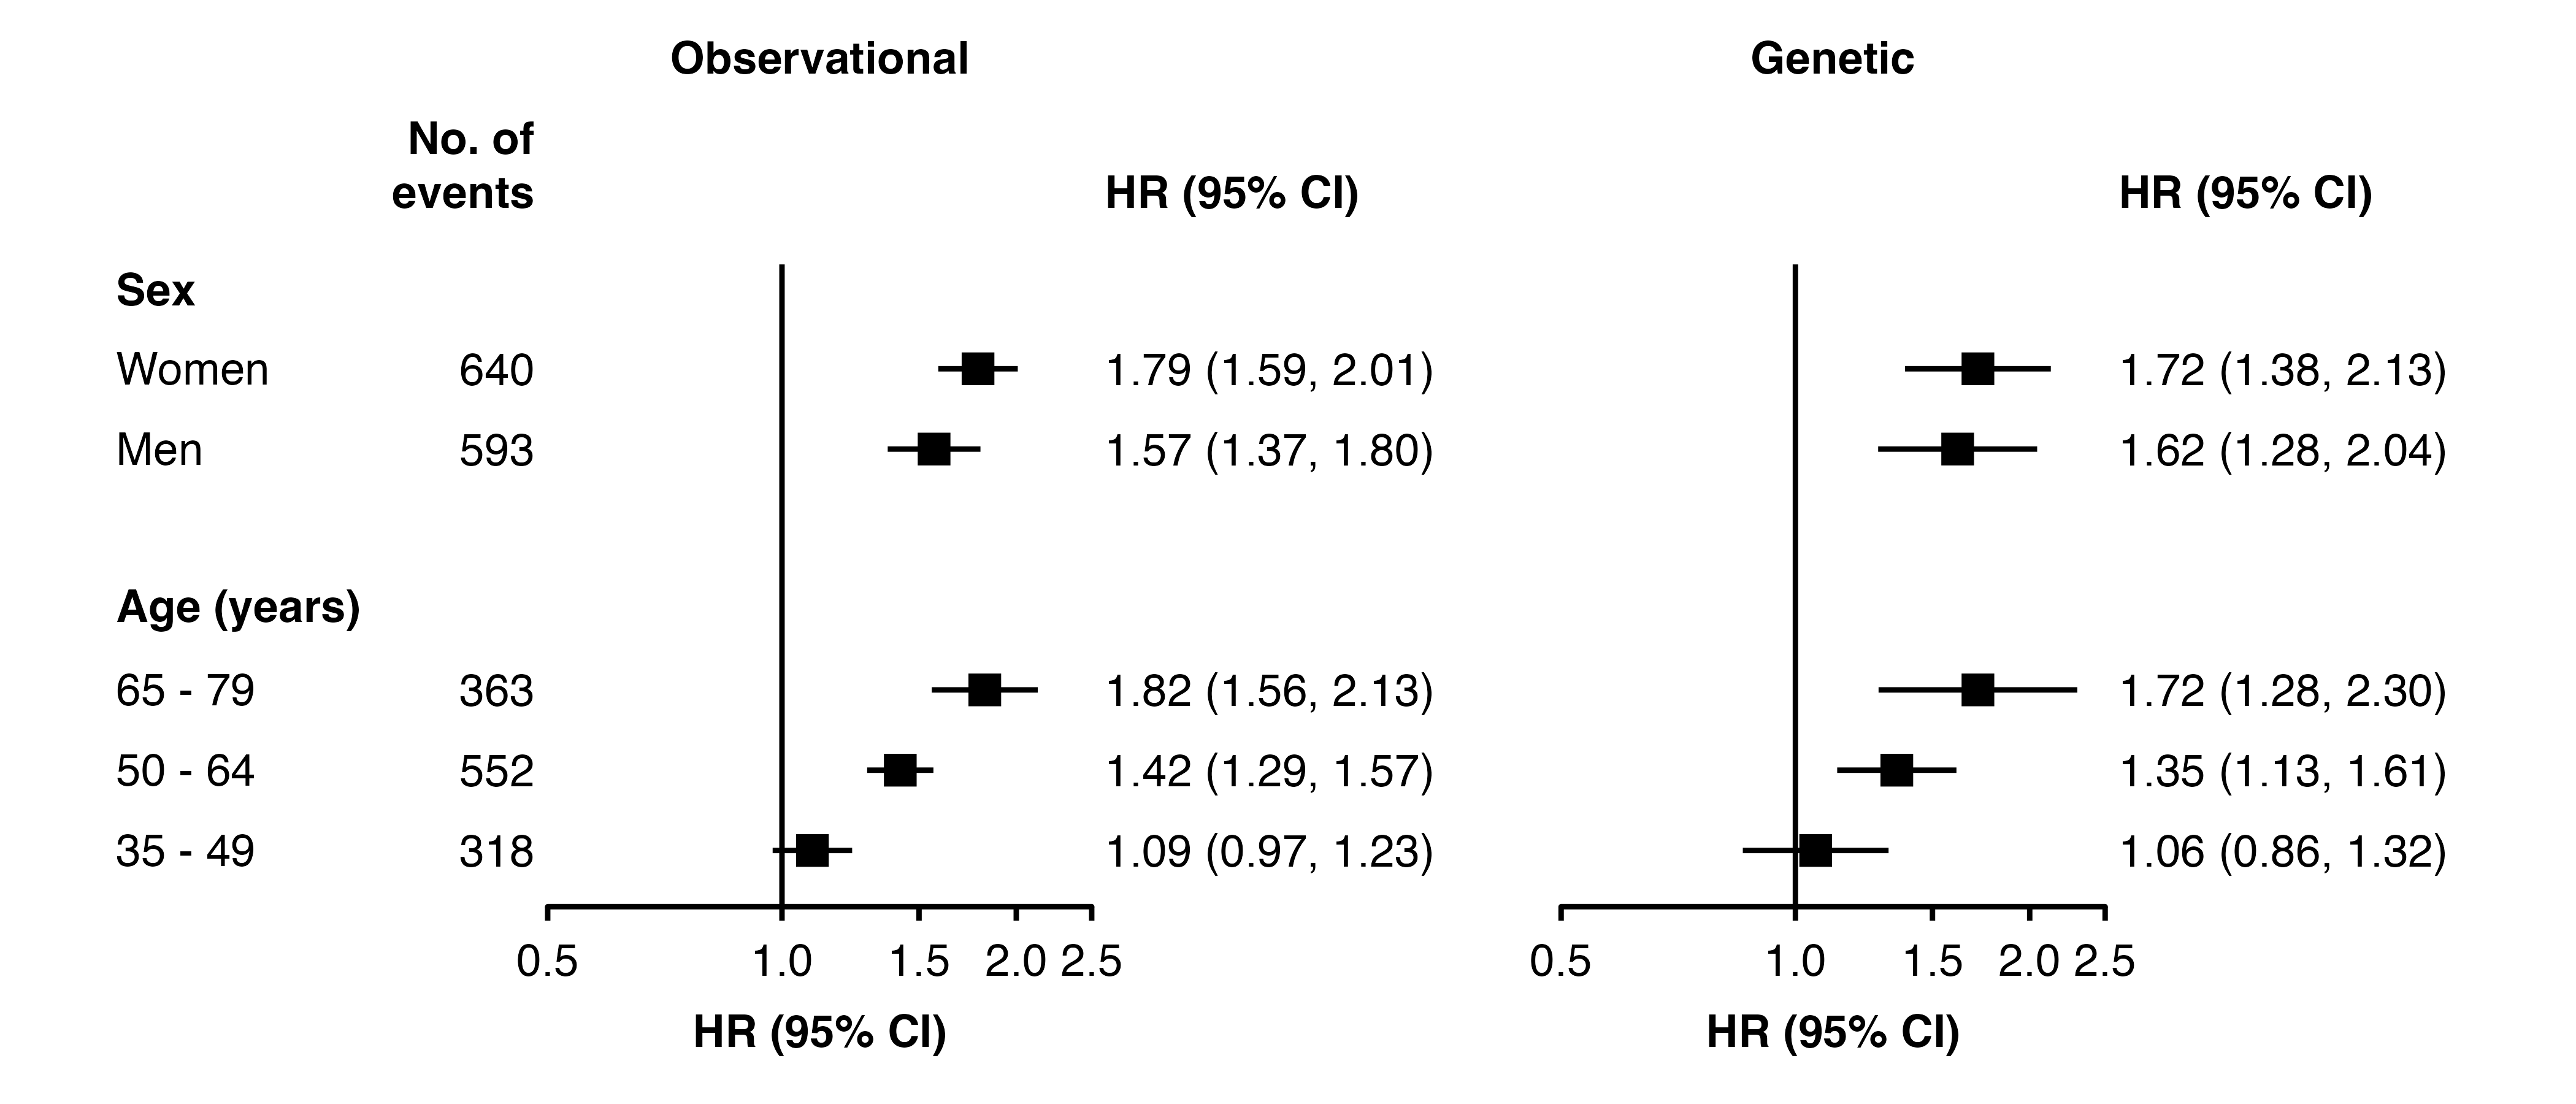
Note that the automatically calculated left.space is now unit(12.9, "mm"). That is, there is now 10mm more space to the left of each panel for the added column of text. To remove the extra 10mm of space between the panels, we subtract this from mid.space (which by default is 5mm):