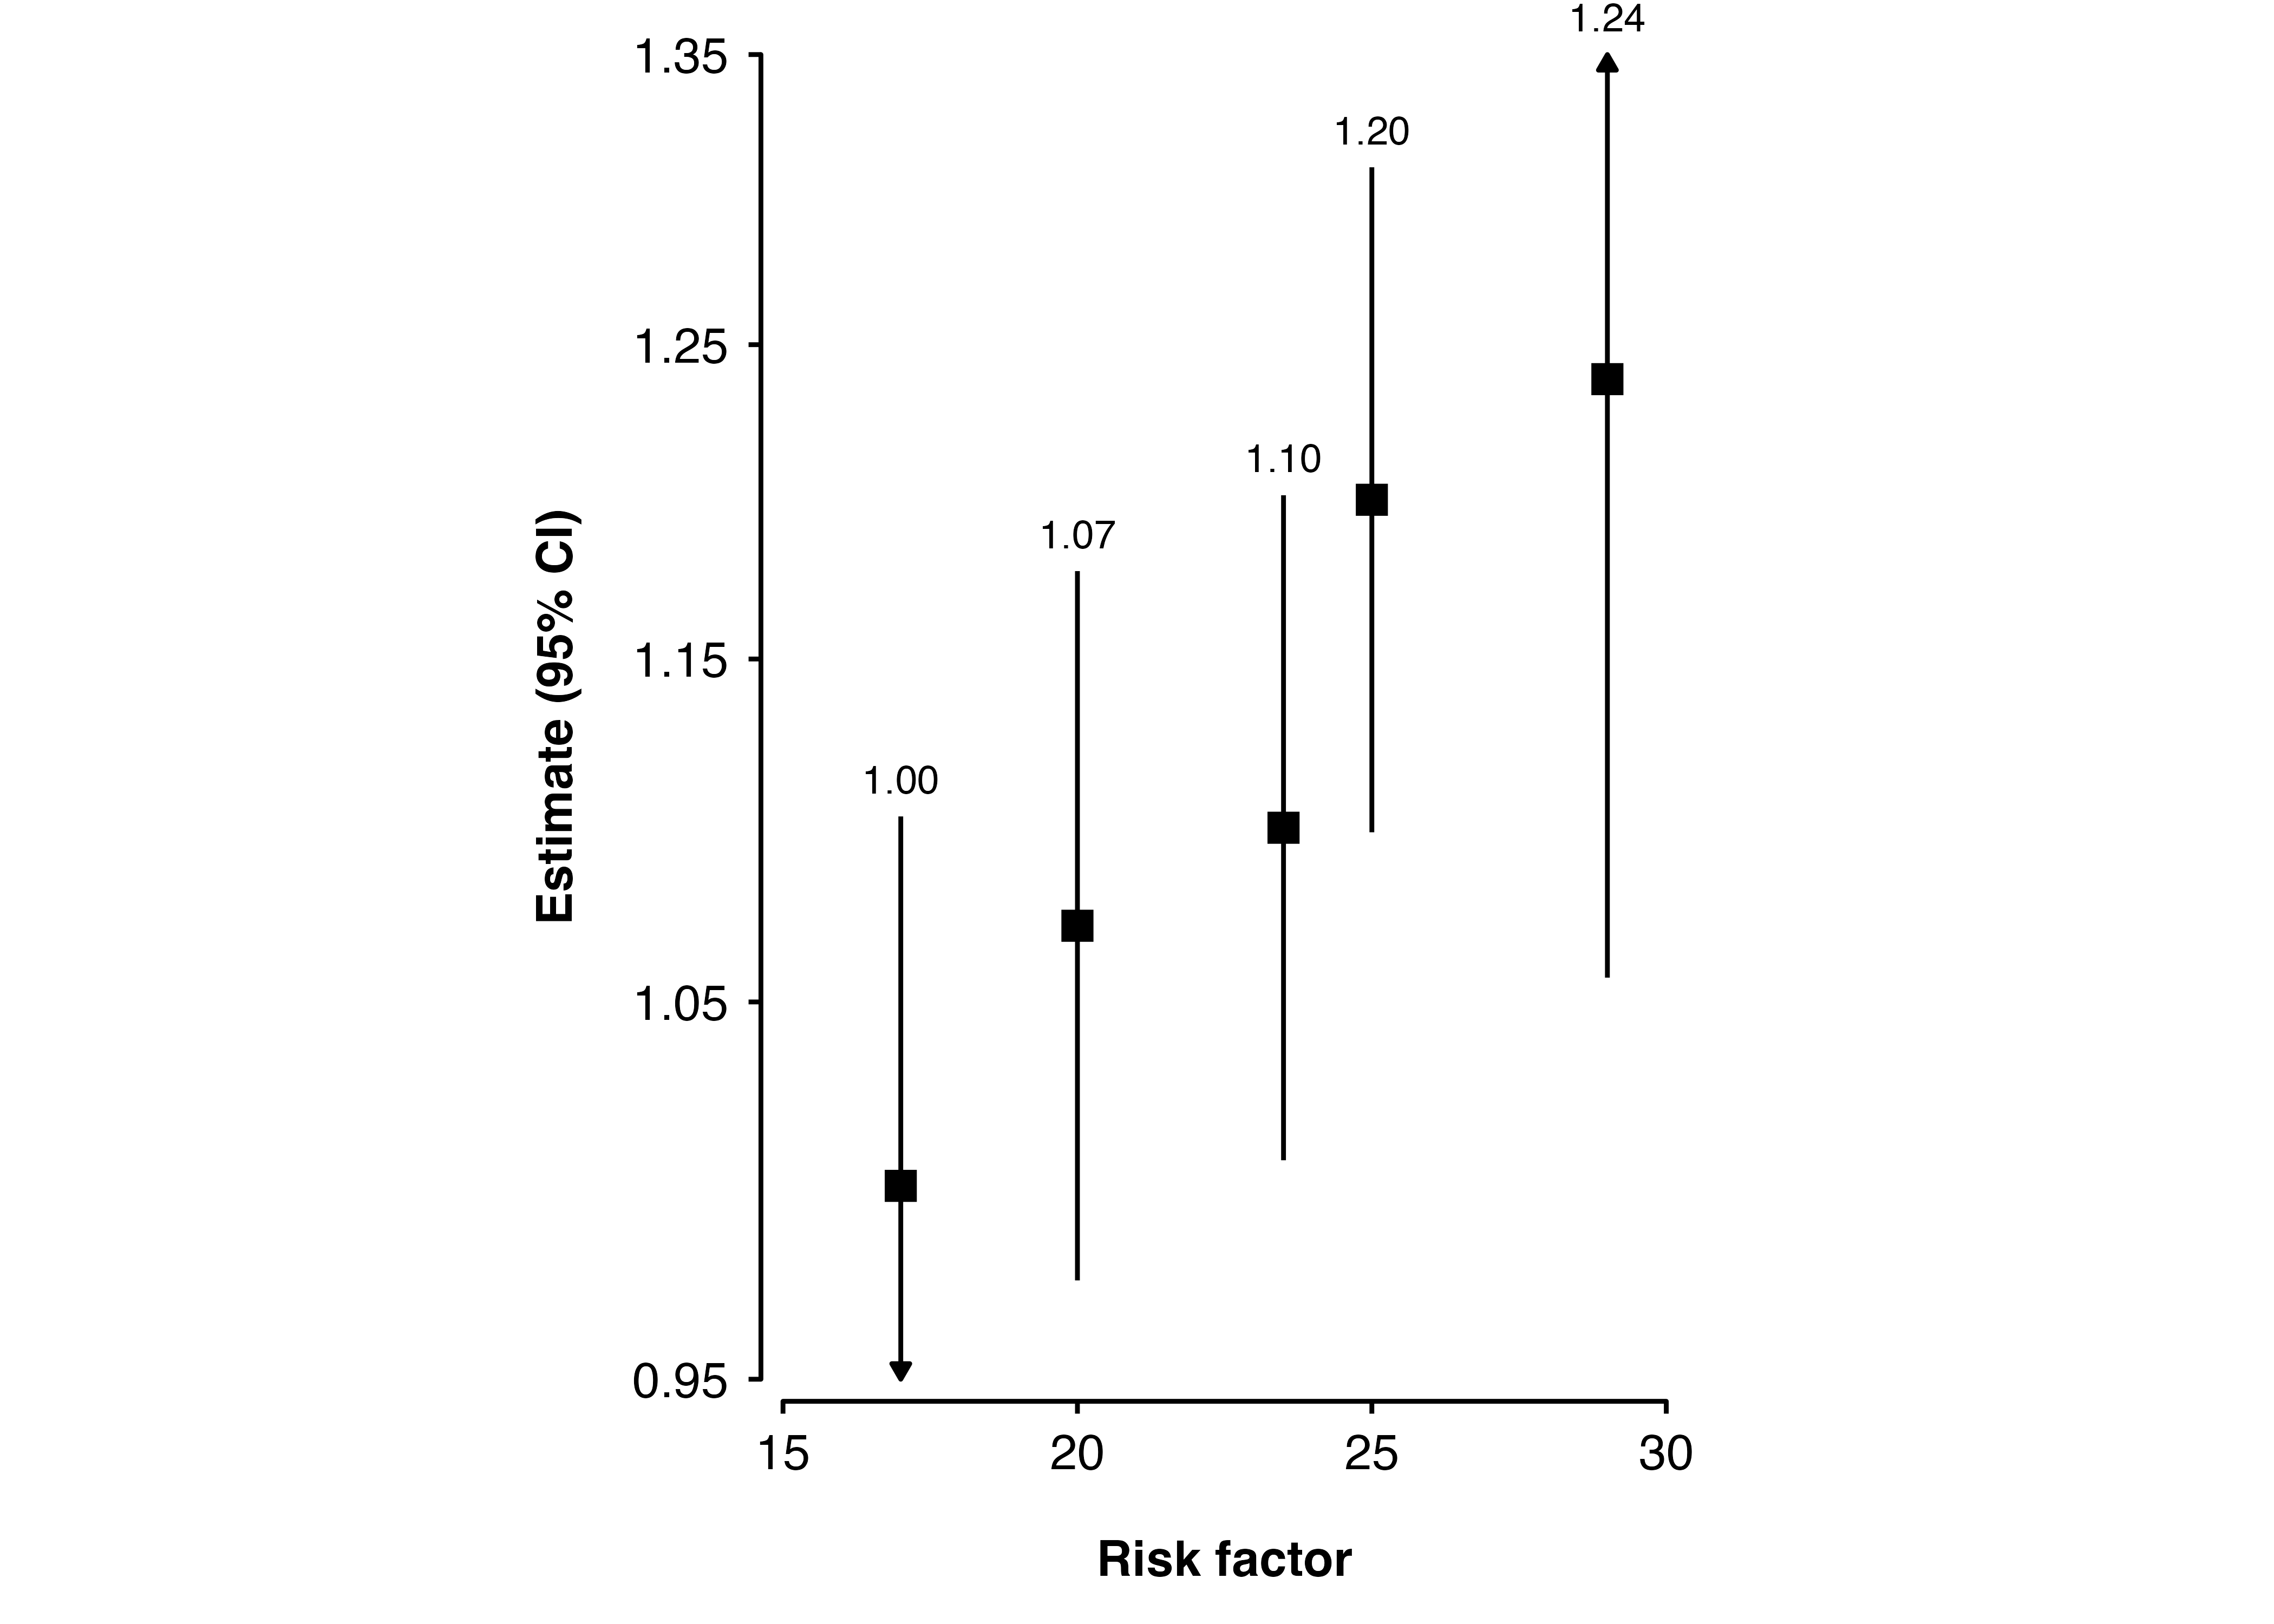
From version 0.12.0 of ckbplotr, if you set ylim in shape_plot() then confidence intervals outside these limits will be truncated and arrows will be added to the plot:
Using shape_plot() you may have confidence interval limits outside your chosen limits for the y axis. The confidence interval lines (and text labels) will extend outside the plotting area and maybe outside the plot entirely.
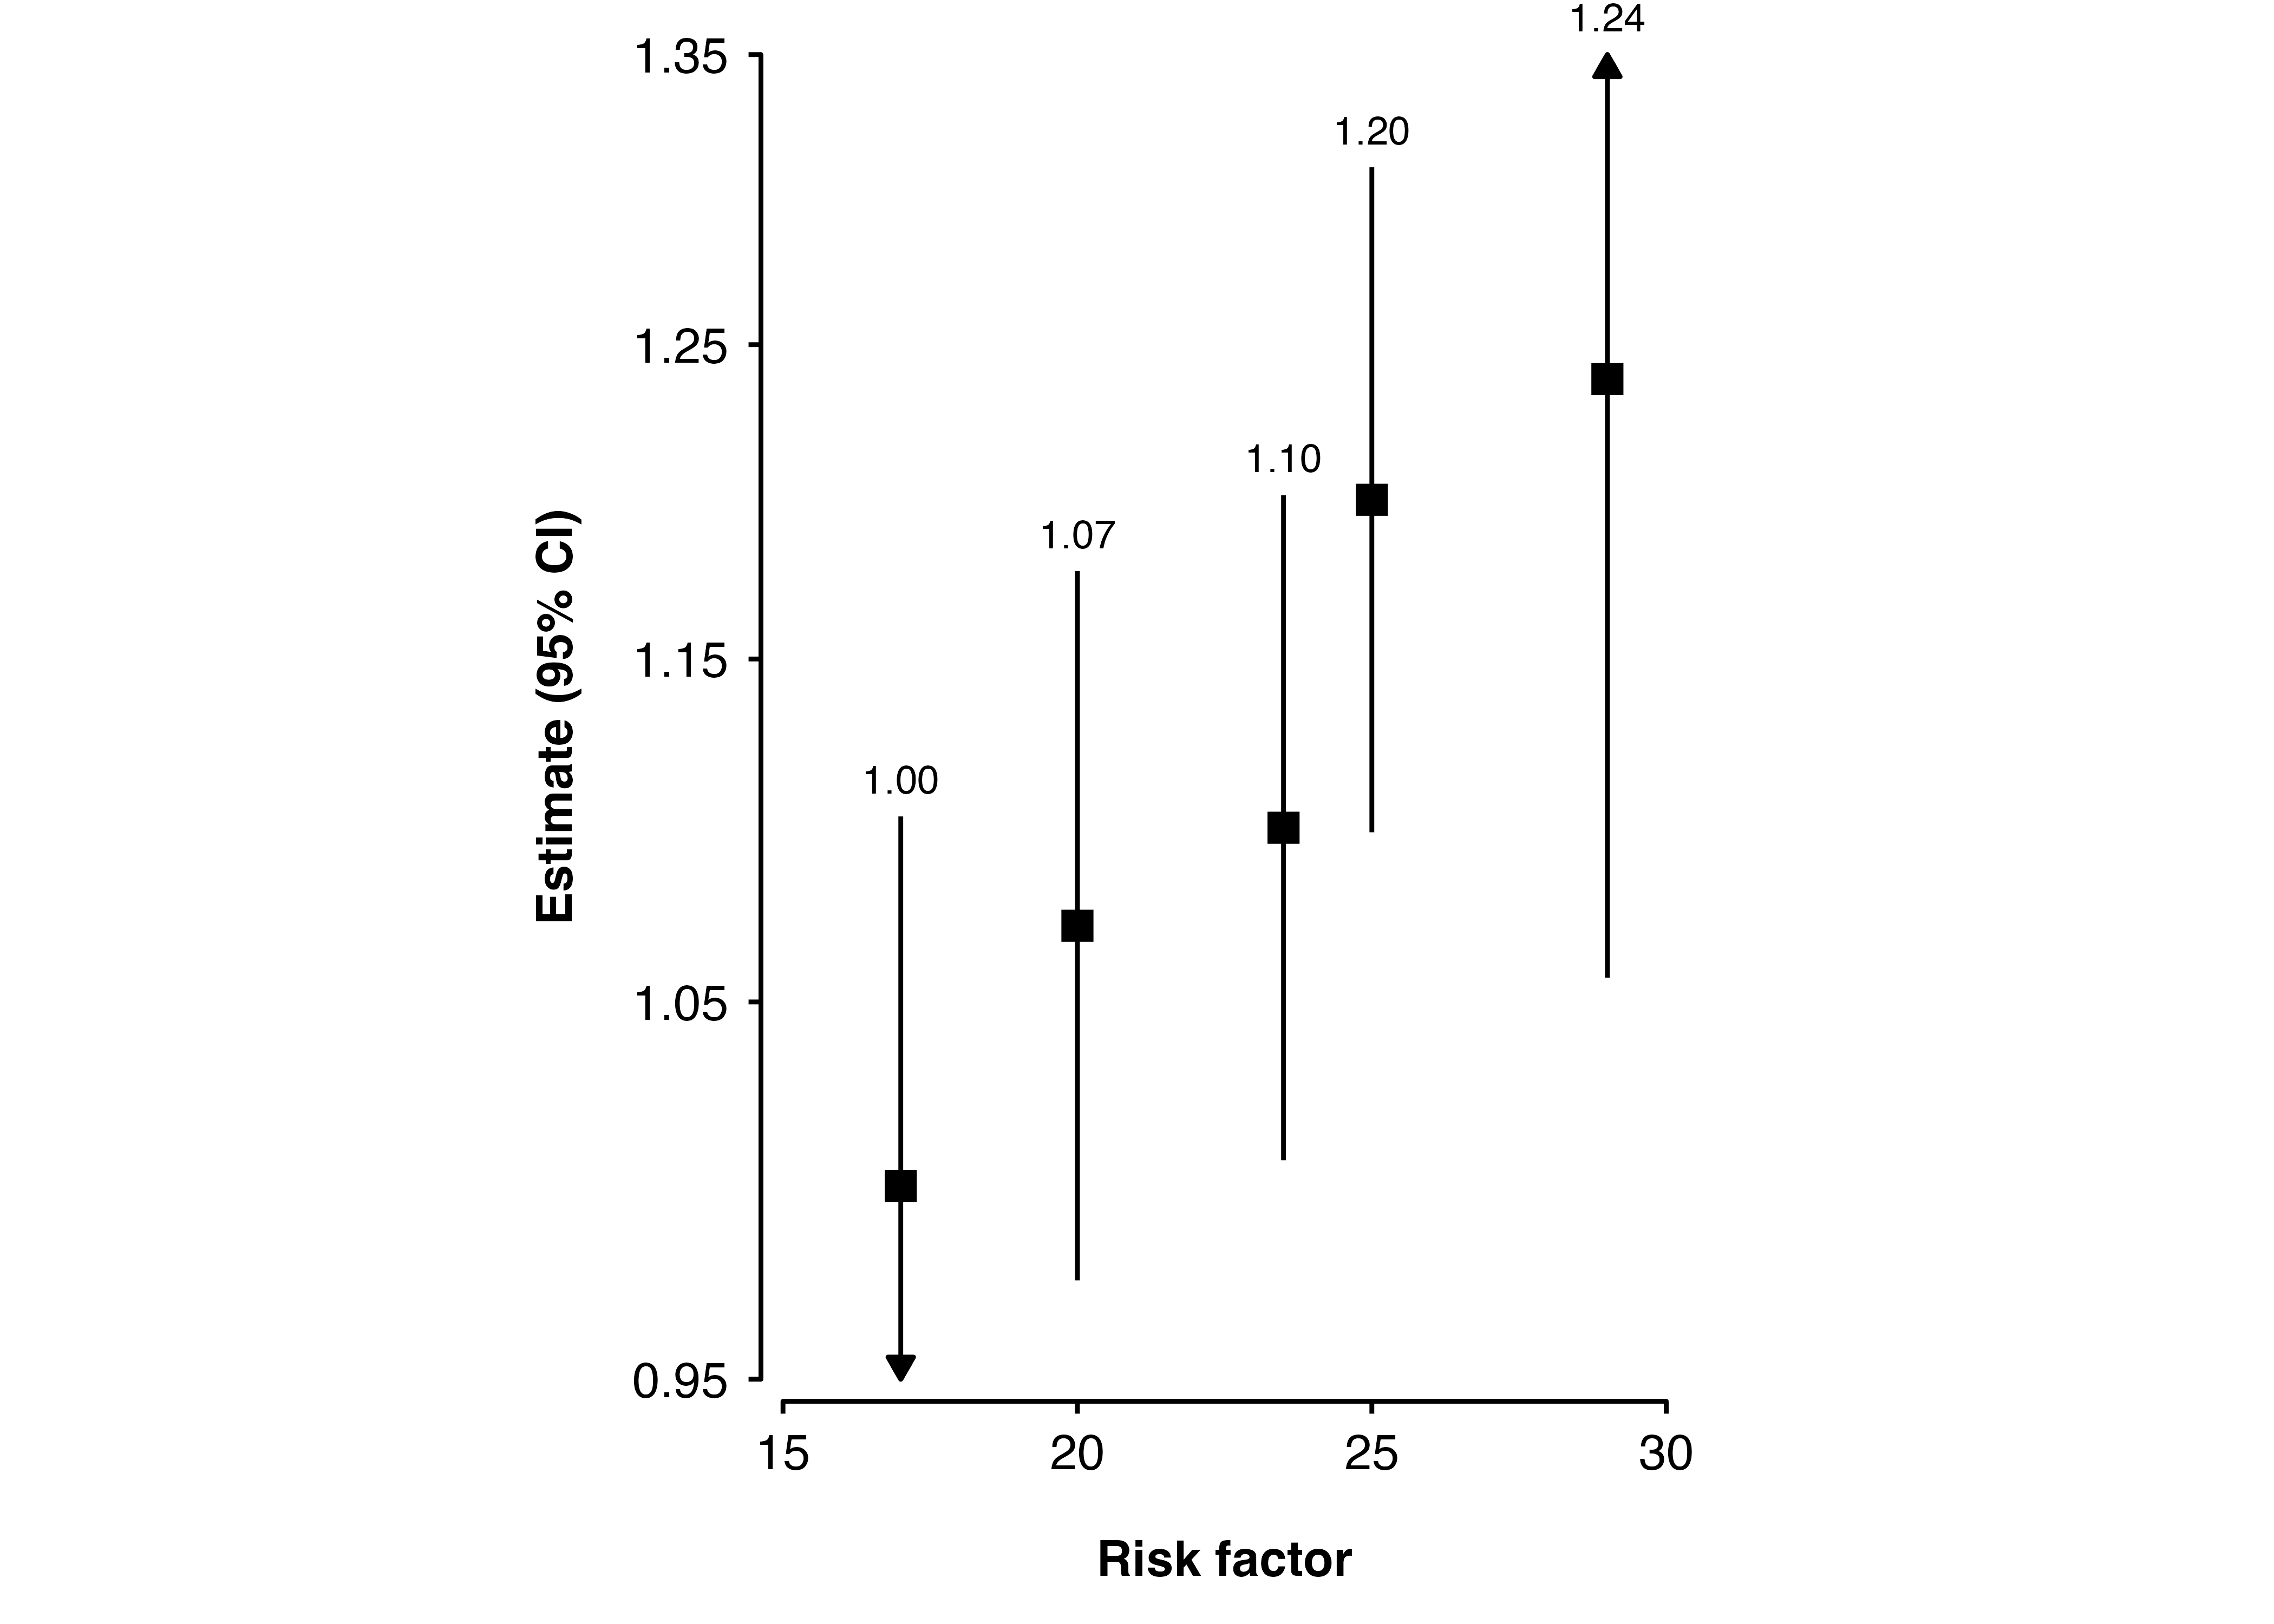
If you definitely want to keep those axis limits, you may want to add arrows to the confidence interval lines. First use addaes in shape_plot() to truncate the confidence interval lines (and change the position of the text):
Then add geom_segment() layers to the plot to add small segments with arrows. Use the data argument to filter the data to only include the rows where the confidence limit is outside the axis limit.